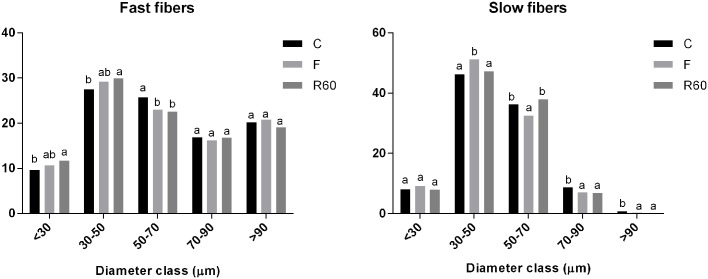
Fig 2. Frequency distribution of fast and slow muscle fibers of pacu juveniles.
Control, before fasting (C); after 10 days of fasting (F) and after 60 hours of refeeding (R60). Letters in the columns compare the frequency of fibers between the groups. Values with the same letters are not statistically significant between the periods (P <0.05. Goodman test).

