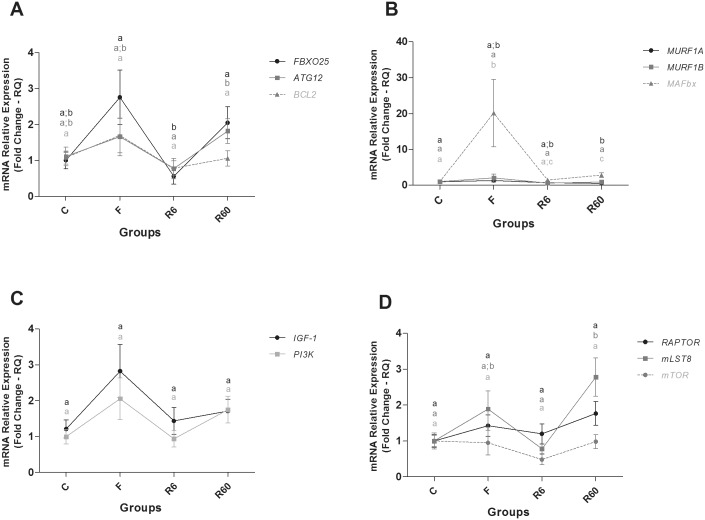
Fig 6. Relative mRNA expression of catabolic and anabolic pathway components in slow muscle.
Groups C (control), F (fasting—10 days of fasting), R6 (6 hours of refeeding) and R60 (60 hours of refeeding). The data are expressed as fold change. Different letters indicate significant differences in expression between the groups (P < 0.05). The data are presented as the mean ± SEM (n = 8).

