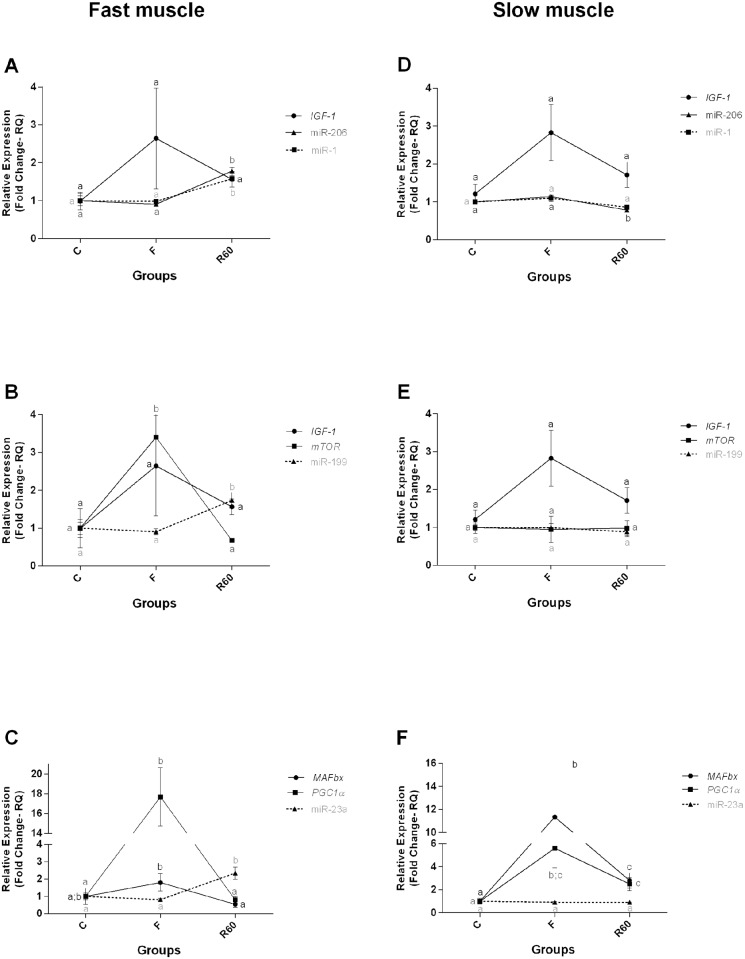
Fig 8. Relative expression of miRNAs and their target genes in fast and slow muscle.
Groups C (control), F (fasting—10 days of fasting) and R60 (60 hours of refeeding). The data are expressed as fold change. Different letters indicate significant differences in expression between the groups (P < 0.05). The data are presented as the mean ± SEM (n = 8).

