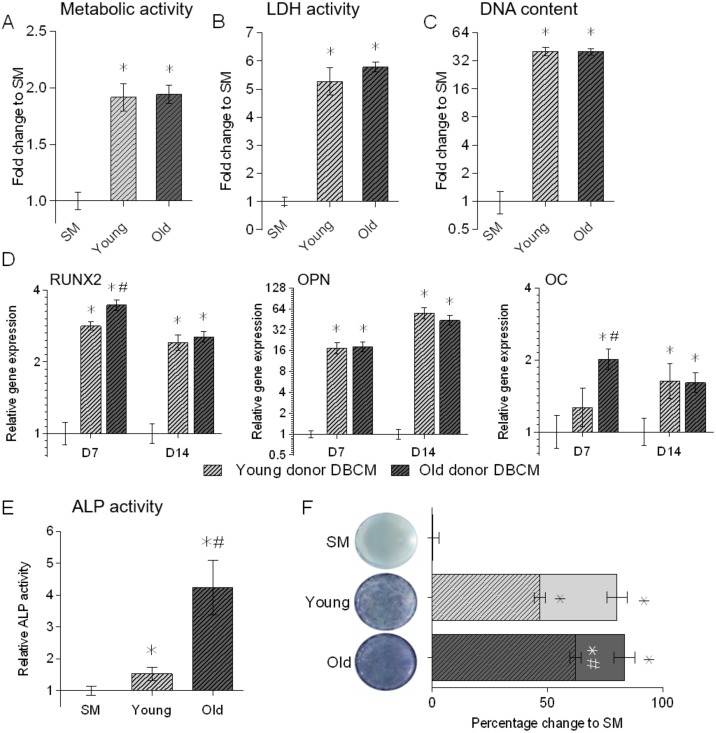
Fig 3. Assessment of the proliferation and osteogenic differentiation of young donor BM-MSCs (N = 3) cultured in triplicate in DBCM from young and old donors (N = 3 for each) for 14 days.
Cell proliferation and viability were assessed by alamarBlue cell health indicator assessment of cell metabolic activity (a), picogreen analysis of total DNA in sample (b), and LDH assay for total live cell (c), all in comparison to SM. Relative gene expression of osteogenic markers RUNX2, OPN and OC (d) were normalised to reference gene MRPL19 and SM controls (2-ΔΔCT). Relative ALP enzymatic activity (e), normalised to DNA content, and Visual BCIP NBT staining of active ALP enzyme (f), displayed as quantification of area covered by stain (whole coloured bars) and staining intensity (chequered area) were both normalised to SM controls. All data is shown relative to SM control at the same time-point. Data represent mean ± SE. * indicates significant difference to day 0 (p≤0.05). # indicates significant difference between DBCM at the same time-point (p≤0.05).

