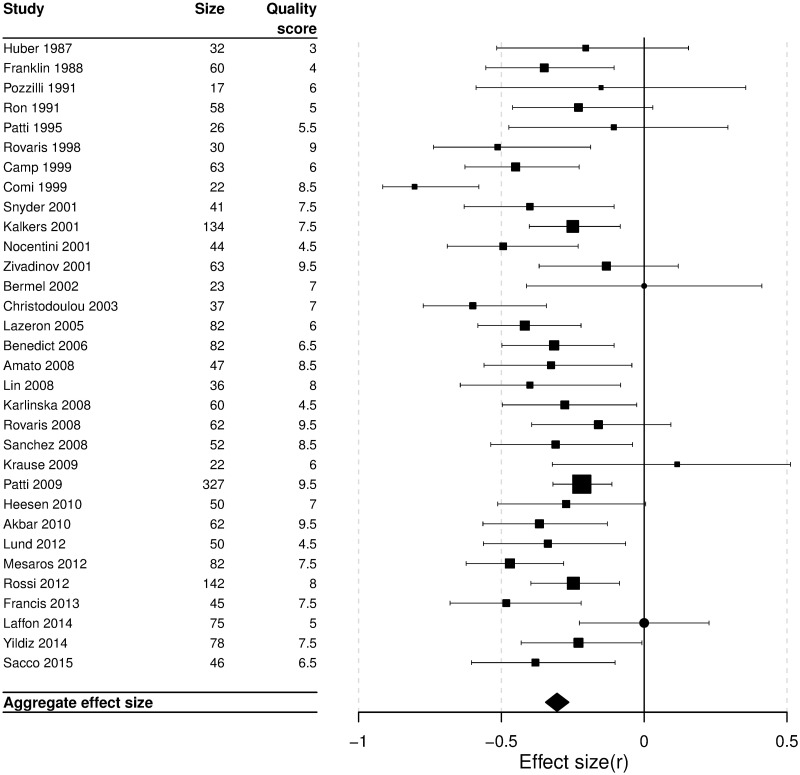
Fig 3. Forest plot of the individual studies showing their effect sizes as correlation coefficients.
Box sizes are inversely proportional to study variance. Manuscripts reporting “non-significant” results without a point estimate are represented by circles. Aggregate effect size: r = -0.30; 95% confidence interval: -0.34, -0.26.

