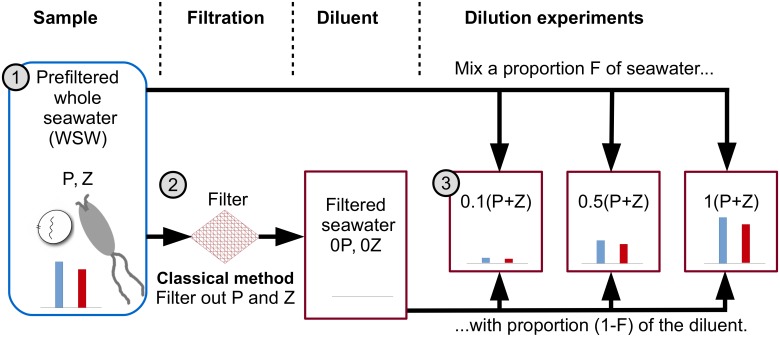
Fig 1. Schematic of the classical dilution method of Landry and Hassett.
1. Sample Environmental samples are prefiltered to focus on microbial communities—this is termed whole seawater (WSW). Dilution method theory assumes WSW contains microzooplankton and the phytoplankton they graze upon. 2. Filtration The classic dilution method filters some WSW to create a diluent containing no phytoplankton or microzooplankton. 3. Dilution series A series of bottles are filled with a proportion F of WSW and mixed with a proportion (1 − F) of the diluent creating a dilution series. The blue and red bars represent the relative abundance of phytoplankton and microzooplankton. Apparent growth rates are calculated by measuring the differences in phytoplankton population sizes in each bottle across the dilution series at two time points (the beginning and end of an incubation period). The microzooplankton grazing rate is estimated by finding the gradient of a linear regression model between the dilution level F and the apparent growth rate.

