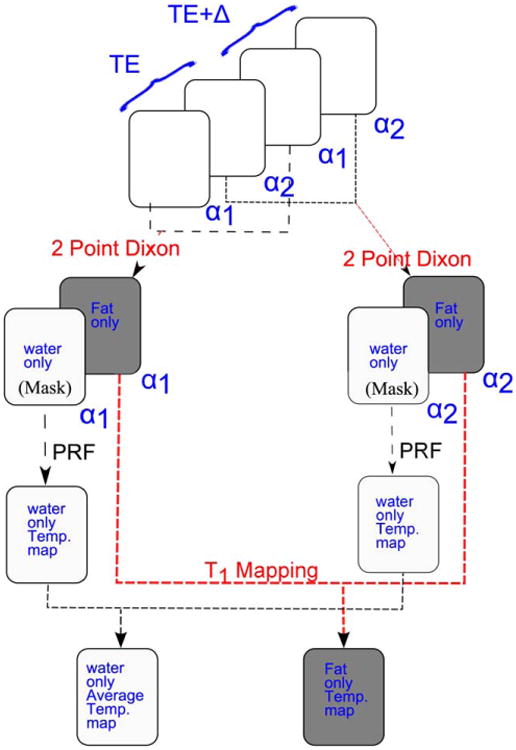
Fig. 3.

Schematic diagram of the simultaneous fat and aqueous tissue temperature imaging using the two-point Dixon hybrid PRF-T1 acquisition method. The two temperature maps, PRF and T1, are acquired in a series of four images. Images acquired at the same flip angle are combined using the extended two-point Dixon methods to separate fat and aqueous tissues. The water-based tissue-only images are used to mask the original complex images to remove the fat signal. The phases of the aqueous tissue in regions where fat and water voxels overlapped due the chemical shift were computed using Equation [7]. A high SNR PRF temperature map was obtained by averaging over the phase maps of the two FAs. The T1 map of the fat was computed from the fat-only images using the DFA method.
