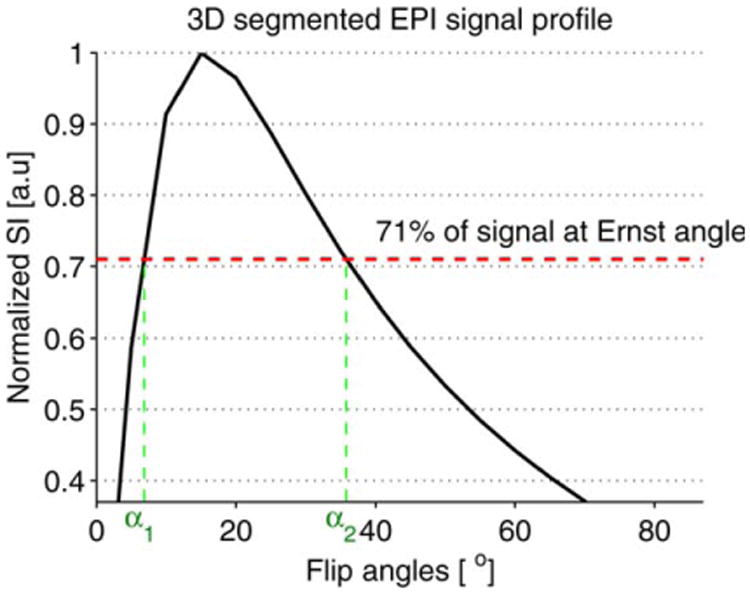
Fig. 4.

Plot of the normalized signal intensity (SI) of the 3D segmented flyback EPI sequence versus the flip angles. The maximum T1 precision is achieved by choosing the flip angles such that SIa1=SIa2= 71% of the SI at Ernst angle αE. The plot is zoomed in to show the locations of the two optimal flip angles.
