
Fig. 7.
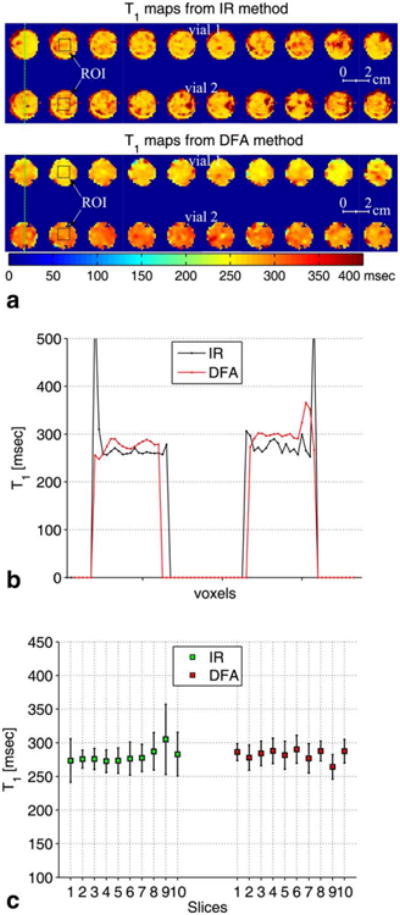
a: The top row shows zoomed-in T1 maps of the 10 coronal slices in ascending order of the breast fat tissue from patient 1 (see Table 1) computed using the inversion recovery (IR) method. The bottom row shows T1 maps of the same coronal slices using the DFA method. b: Line plots along the green dashed lines on the IR and the DFA T1 maps of slice 1. c: Error bar plots of the T1 maps of the 10 slices. The error bar plots show the mean and the standard deviation of T1 calculated over an ROI of 7 × 7 pixels shown by the black squares on slice 2 of the T1 maps obtained from the IR and the DFA methods.