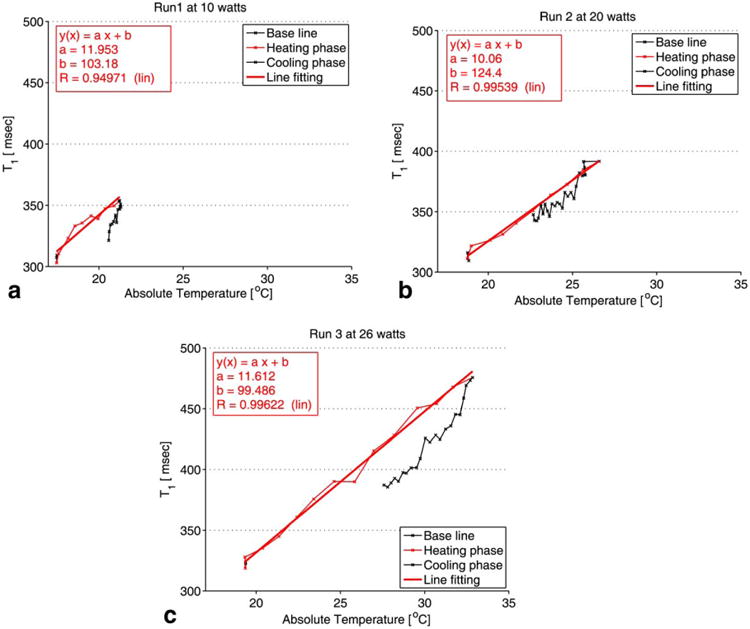
Fig. 8.

T1 profile in slice 5. All measurements were performed in adipose tissue. The plot of the absolute T1 versus the temperature reading of the fiber optic temperature probe is shown for each of the three HIFU heating runs: 10W (a), 20 W (b), and 26 W (c). T1 was computed over an ROI of 2 × 2 pixels near the tip of the fiber optic temperature probe. The standard deviation of the absolute T1 change was ±5 ms.
