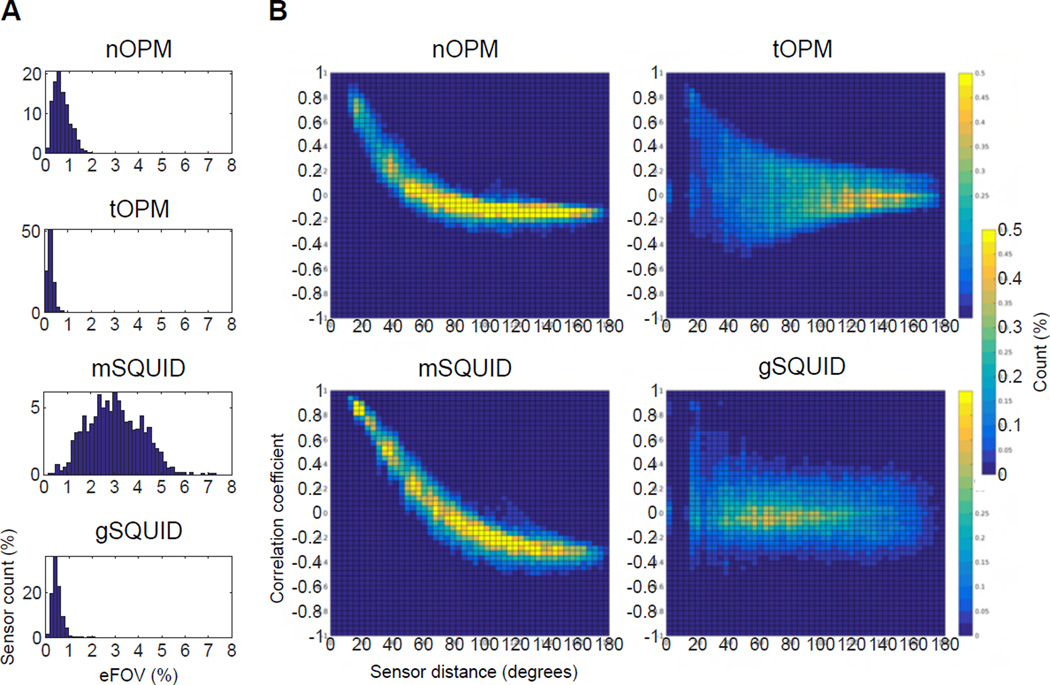
Figure 5.
The effective field-of-view (eFOV) of the sensors and correlation of lead fields. A: Histograms of eFOV with values from different subjects pooled. eFOV is measured as a percentage of the total area of cortex. Each histogram has been normalized by the total number of sensors across the subjects. B: Histograms presenting the correlation coefficient between sensor lead fields as a function of sensor distance in degrees. The lead-field correlations across the subjects and sensors have been pooled. Each histogram has been normalized so that the sum over the bins gives 100%.

