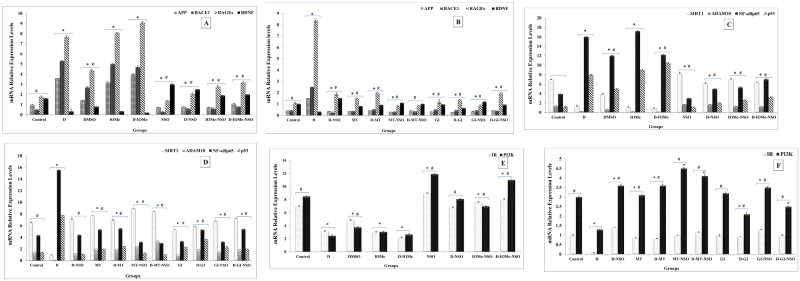
Fig 2. Gene expression profiles of brain amyloidogenic, neuro-protection and insulin signaling biomarkers.
mRNA levels by RT-PCR analysis for APP, BACE1, BDNF and RAGEs in brain tissues of diabetic and I-OMeAG538- injected rats versus NSO- treated rats (A). mRNA levels of APP, BACE1, BDNF and RAGEs in the brain of diabetic rats post the treatment with NSO, reference drugs and combination therapy (B). mRNA levels SIRT1, ADAM10, NF-κBp65 and p53 in the brain of diabetic rats, I-OMe-injected rats versus NSO treated rats (C). mRNA levels of SIRT1, ADAM10, NF-κBp65 and p53 in brain tissues of diabetic rats, and after treatment with NSO, reference drugs and combination therapy for (D). mRNA levels of IR and PI3K in the brain of diabetic rats, I-OMeAG538-injected rats versus NSO treated rats (E). mRNA levels of IR and PI3K in the brain of diabetic rats, and after treatment with NSO, MT, GI and combination therapy for IR and PI3K (F). β-actin was used as an internal control and quantification of bands using UVIBAND Image quantification software.

