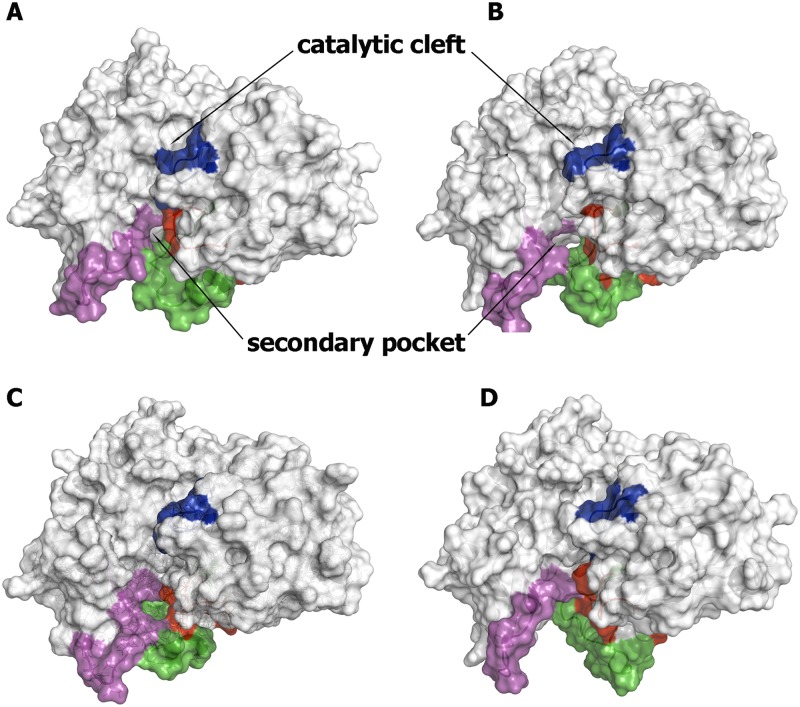
Fig 6. Representative snapshots of BACE-1 with the loop 8–14 in the out conformational state.
Structures were taken from clusters 13 (1.5%; A), 22 (0.8%; B), 25 (0.5%; C), and 26 (0.4%; D). The flap region is shown in blue, and the loops defined by residues 8–14, 154–169, and 307–318 are shown in red, green and magenta, respectively. The size of the secondary pocket in the selected snapshots is around (A) 460, (B) 520, (C) 770, and (D) 1,250 Å3.

