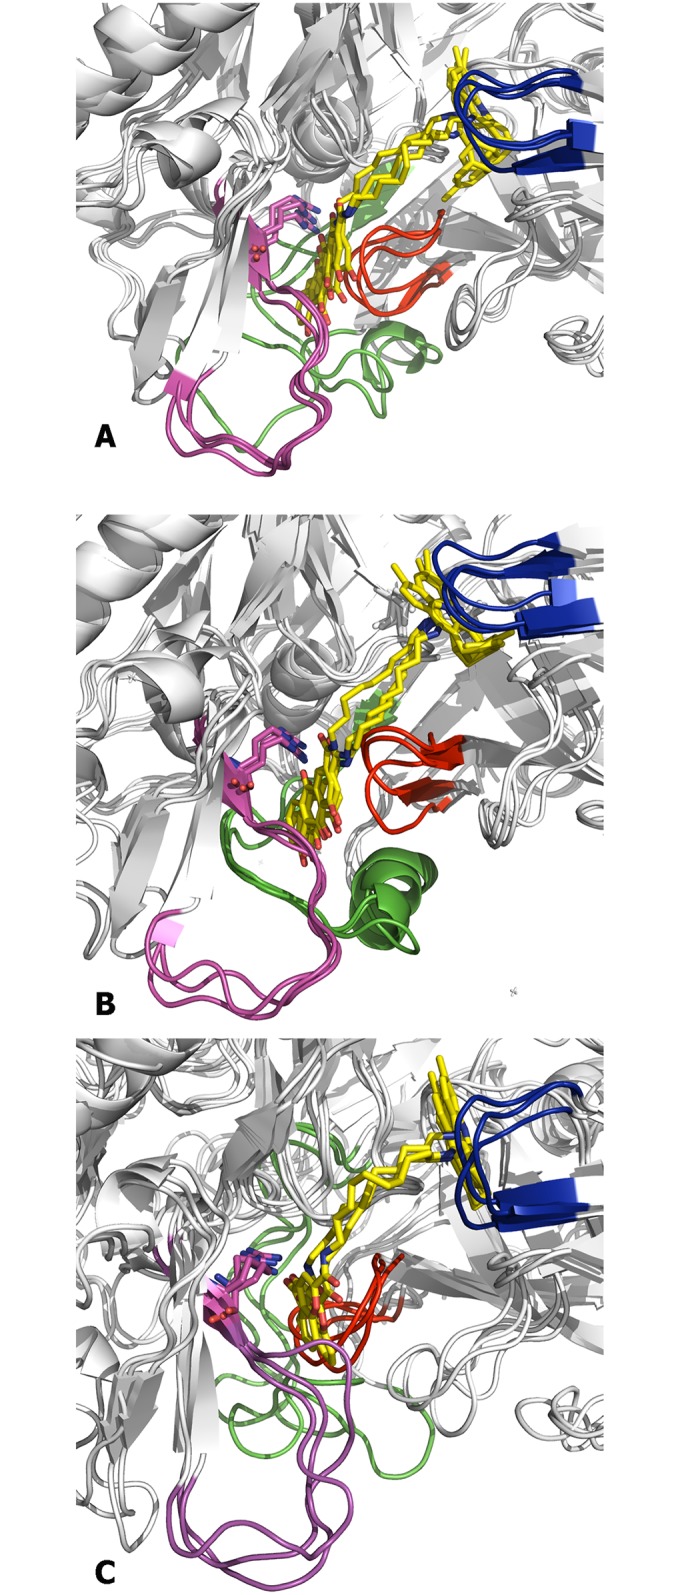
Fig 9. Superposition of the snapshots collected at the end of the trajectories run for the BACE-1 complexes with hybrid compounds (A) (+)-1, (B) (–)-1, and (C) 3.

The protein backbone is shown as white cartoon. The flap region is shown in blue, and the loops defined by residues 8–14, 154–169, and 307–318 are shown in red, green and magenta, respectively. Arg307 is shown in sticks.
