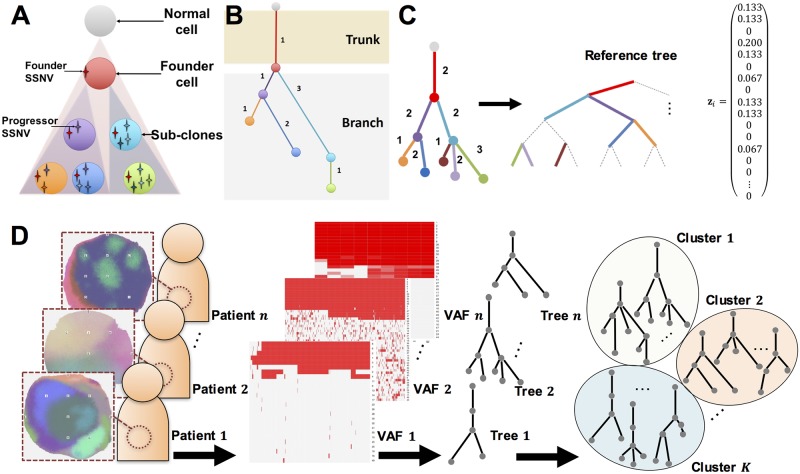
Fig 1. Overview of the proposed method.
(A) Example of cancer evolution. A founder cell is established after a normal cell acquires several passenger mutations and driver mutations (founder SSNVs), and sub-clones evolve by acquiring progressor SSNVs. Each color (purple, orange, dark blue, light blue, and green) of circles represents different sub-clones. (B) Example of a cancer evolutionary tree in the case of (A). A root and its immediate node represent the normal cell and founder cell, respectively. Subsequent nodes indicate sub-clones and edge lengths indicate the number of SSNVs acquired in the sub-clones. (C) Example of the registration of a tree. To resolve (p1)–(p4) for comparison of the evolutionary trees, a sufficiently large bifurcated tree is constructed, which is the reference tree (note that we have omitted bifurcation from the root for clearer visualization). The tree topologies and attributes are mapped to the reference tree beginning with those with the largest depths to those with the smallest depths. In the case of a tie, the sub-trees are mapped from those with the largest edge lengths. Zero-length edges are regarded as degenerated edges (dashed lines). Edge lengths are normalized by the sum of all edge lengths within tumors. The resulting trees can be represented as edge length vectors zi. (D) Clustering cancer evolutionary trees to summarize the evolutionary history of cancer for each patient. The trees are reconstructed based on the VAFs and then n cancer sub-clonal evolutionary trees are divided into K subgroups based on tree topologies and edge attributes. Through the registration, n evolutionary trees can be represented as m-dimensional n vectors in Euclidean space, and a standard clustering algorithm can be applied.

