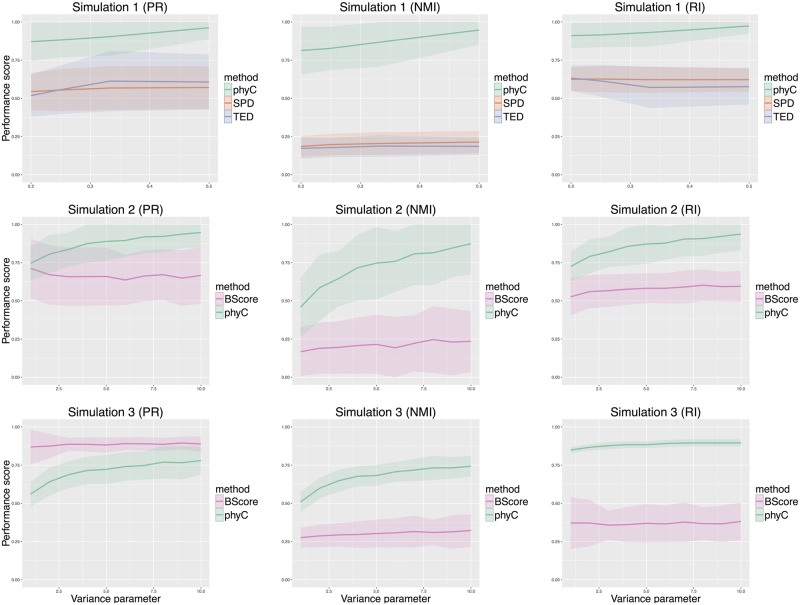
Fig 3. Results of the simulations.
Each row of panels represents the simulation type (simulation I, II, and III), and each column represents the external clustering validation indices: purity (PR), normalized mutual information (NMI), and Rand index (RI). The horizontal axis of each graph is the variance parameter defined in S1 Text, and the vertical axis is the external validation index. The bold lines and the bands indicate the mean and 95% confidence interval of the index for 100 replicates of each dataset.

