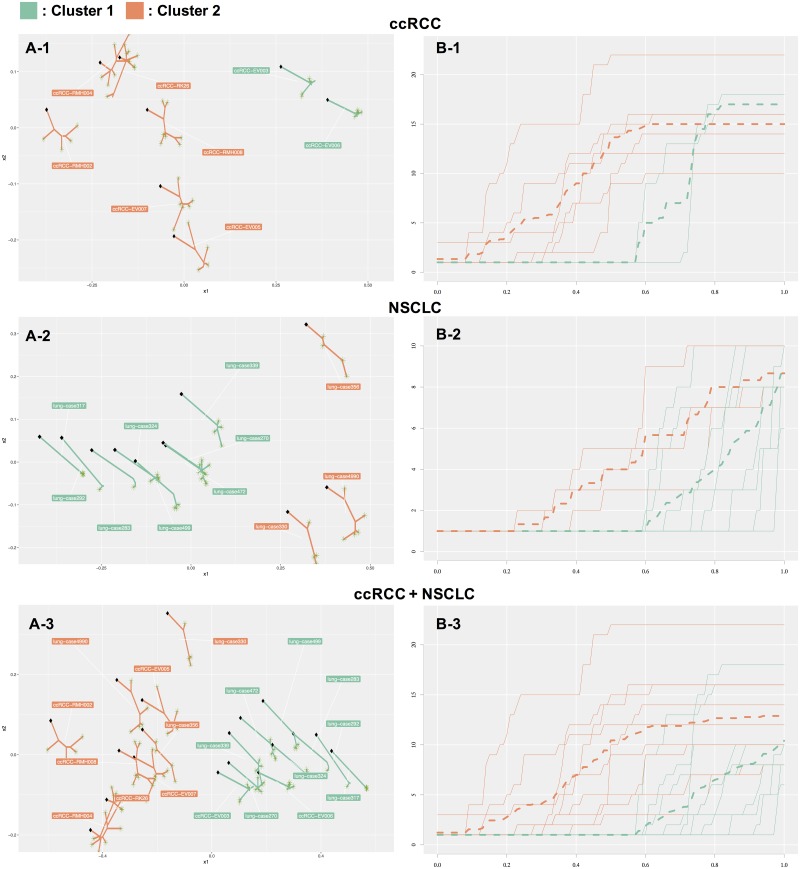
Fig 4.
(A-1) Three clusters of the ccRCC dataset. The x-axis and y-axis are the lower dimensions reconstructed by CMDS. Clusters 1 (green) and 2 (orange) reflect drug-sensitive evolution and parallel evolution, respectively; we cannot provide a valid interpretation for cluster 3 (purple) at present. (B-1) Sub-clonal diversity plot of the ccRCC dataset. The x-axis and y-axis are the fraction of accumulated SSNVs and the number of sub-clones, respectively. Each color corresponds to the clusters shown in (A). Expansions in cluster 1 occurred with x = 0.6; (i.e., the proportion of SSNVs in the trunk is 60%). This result is in contrast to that obtained for cluster 2 (x = 0.2) and cluster 3 (x = 0.1). Trees in cluster 2 show gradual growth of sub-clonal diversity curves, indicating that these sub-clones acquire a relatively large fraction of SSNVs. The sub-clones independently evolve in spatially distinct regions [21]. (A-2) Two clusters in the NSCLC dataset. Clusters 1 (green) and 2 (orange) reflect the non-recurrent and recurrent group, respectively. Only case 270 and case 356 were misclassified to clusters 1 and 2, respectively. (B-2) Sub-clonal diversity plot of the NSCLC dataset. Each color corresponds to the clusters shown in (A-2). (A-3) Two clusters in the ccRCC and NSCLC datasets combined. Clusters 1 (green) and 2 (orange) represent the cancer types NSCLC and ccRCC, respectively. (B-3) Sub-clonal diversity plot of the ccRCC and NSCLC datasets.

