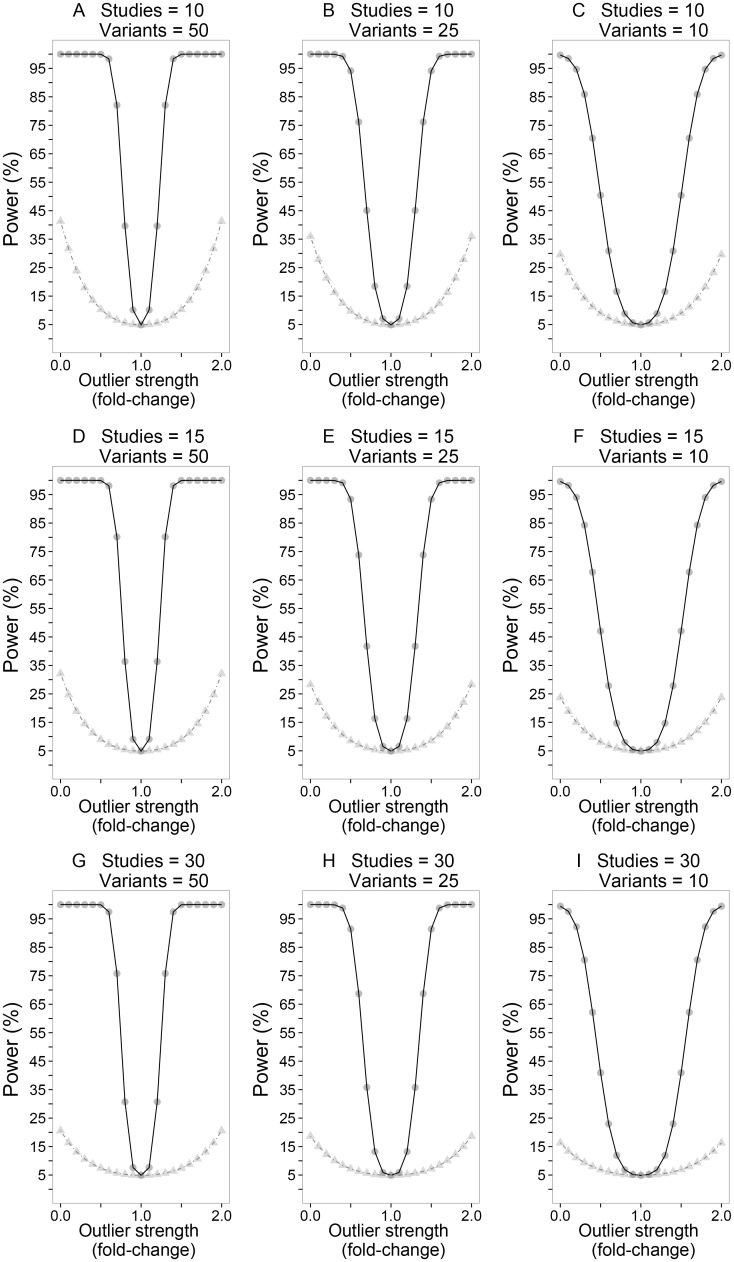
Fig 1. A comparative power analysis of M and Cochran’s Q to detect systematic heterogeneity.
The nine panels show (from left to right) simulations for 10, 15 and 30 studies, examined at 50, 25 and l0 variants; Data points for the M statistic are represented by filled circles whilst those for Cochran’s Q are denoted by filled triangles. Each data point represents a meta-analysis scenario where effect sizes for the non-outlier studies were held constant (loge(odds ratio) = 0.182 i.e. odds ratio = 1.2) to model homogeneous effects. The effect sizes of variants in the outlier study were the product of the non-outlier effect size (i.e. loge(odds ratio) = 0.182) and a parameter (fold-change) to model a continuous series of systematic heterogeneity patterns. All studies were equally weighted (standard error of loge(odds ratio) = 0.1).

