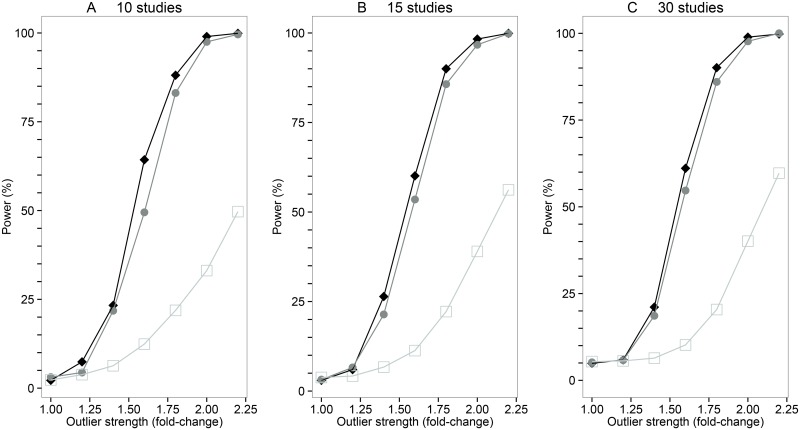
Fig 2. The power of the M statistic to detect systematic outlier studies.
A power analysis of the M statistics for meta-analysis scenarios with varying numbers of studies and variants. The three panels show (from left to right) simulations for 10, 15 and 30 studies; 50, 25 and 10 variant simulations are shown by filled diamonds, filled circles, or open squares respectively. Each data point represents a meta-analysis simulation with 1,000 replicates, where an outlier study was assigned genetic effects that are x-fold stronger than the effects assigned to the remaining studies showing typical effects. Effect sizes for variants in the studies showing typical effects were allocated from an L—shaped distribution (S2 Table) whilst effect sizes for variants in the outlier study were calculated as a multiple of the typical effect size. For example, effect sizes for variants in an outlier study 2-fold-stronger than studies showing typical effects would be computed as (2 x ({0.04, 0.12, 0.2, 0.28, 0.4}, σ = 0.10).

