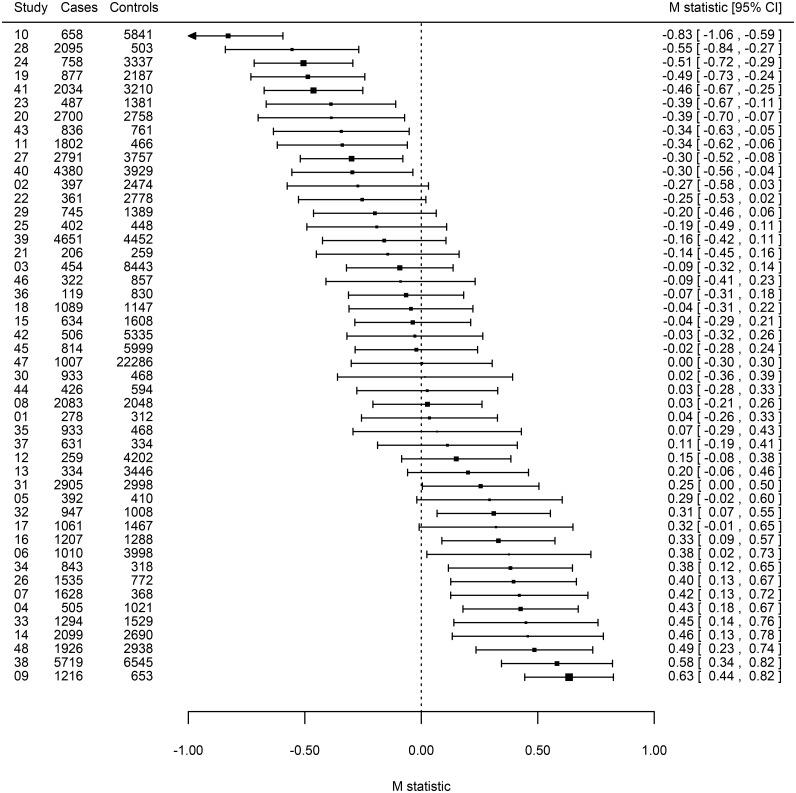
Fig 3. Forest plot of M statistics summarizing systematic patterns of heterogeneity among studies in the CARDIOGRAMplusC4D GWAS meta-analysis.
Sorted M statistics are presented for individual studies represented by filled squares with their 95% confidence intervals shown by horizontal lines; the sizes of the squares are proportional to each studies’ inverse-variance weighting. Studies showing weaker (M < 0) than average genetic effects can be distinguished from those showing stronger (M > 0) than average effects.

