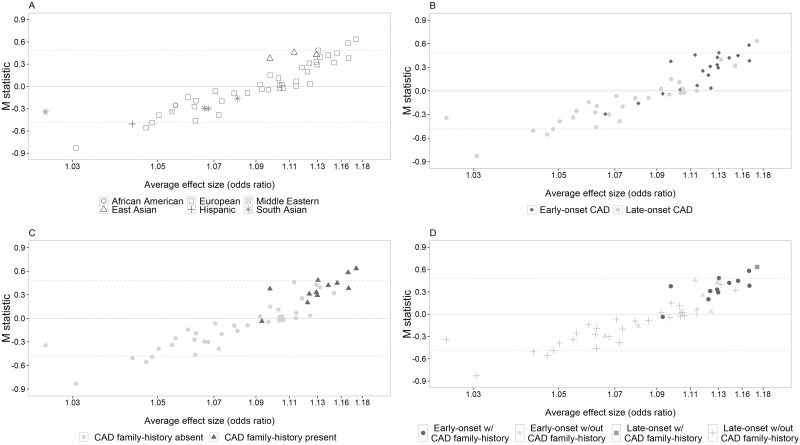
Fig 4. Heterogeneity in the CARDIoGRAMplusC4D meta-analysis can be explained by differences in age of CAD onset, family history and ancestry.
M statistics for each study in the CARDIoGRAMplusC4D meta-analysis (Y- axis) are plotted against the average variant effect size (expressed as odds ratios) (X-axis) in each study. Panel A shows the ancestry of each study, panel B distinguishes early-onset from late-onset studies and panel C identifies studies ascertained with a positive family history of coronary artery disease. Panel D is a composite plot showing the degree of genetic enrichment among the studies in the meta-analysis, which ranged from non-enriched (late-onset studies without a positive family history of coronary artery disease) to doubly enriched (early-onset studies with a positive family history of coronary artery disease). The dashed lines indicate the Bonferroni corrected 5% significance threshold (M = ±0.483) to allow for multiple testing of 48 studies.

