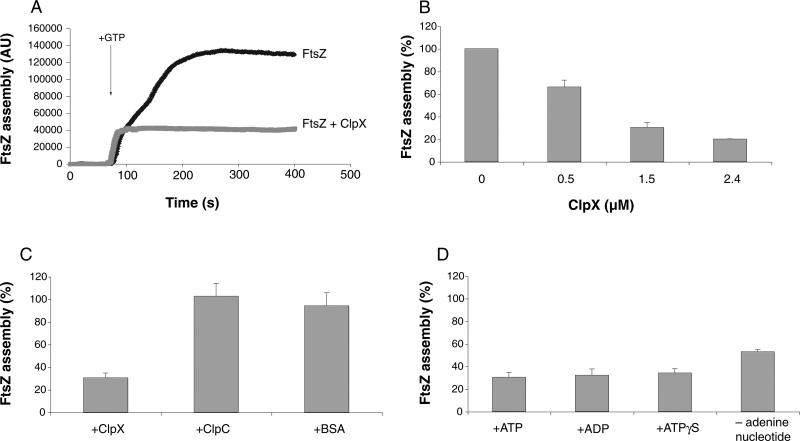
Fig. 4.
ClpX inhibits FtsZ assembly in vitro in a 90° angle light scattering assay. Unless indicated otherwise, all reactions are performed in the presence of 1 mM ATP with an FtsZ concentration of 2.5 μM. Assembly values in (B), (C) and (D) represent maximal levels of FtsZ assembly in the presence of ClpX relative to FtsZ assembly in the absence of ClpX. Error bars represent standard deviation.
A. Representative light scattering plot of FtsZ (black trace) and FtsZ + ClpX (grey trace). FtsZ assembly was initiated by the addition of 1 mM GTP.
B. Dose-dependent inhibition of FtsZ assembly by ClpX.
C. Inhibition of FtsZ assembly by ClpX is specific to ClpX. ClpX, ClpC and BSA were added to a final concentration of 1.5 μM.
D. ATP hydrolysis is not required for inhibition of FtsZ assembly by ClpX. ATP, ADP and ATPγS were added to 1 mM where appropriate.

