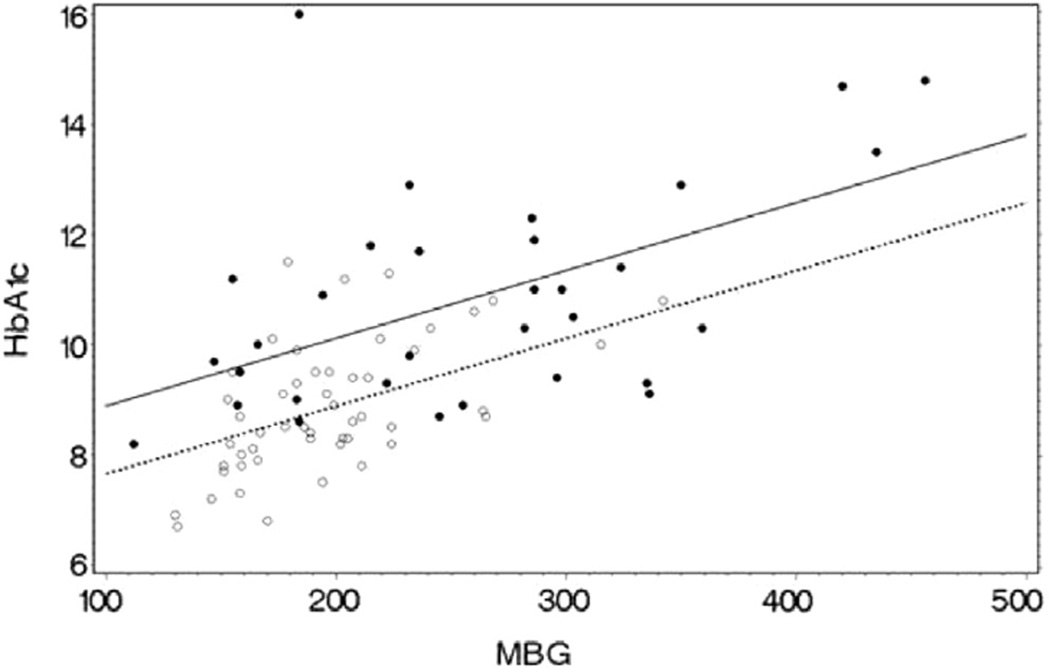
Figure.
The relationship of HbA1c with MBG by race in youth with T1D. Black dots and unbroken regression line represent Black patients. Open circles and broken regression line represent White patients. Blacks have a higher HbA1c than Whites at similar levels of MBG. HbA1c (%) and MBG in mg/dL. Both MBG (P < .0001) and race (P = .003) have statistically significant independent influence on HbA1c when also adjusted for the influence of age and RDW-CV.

