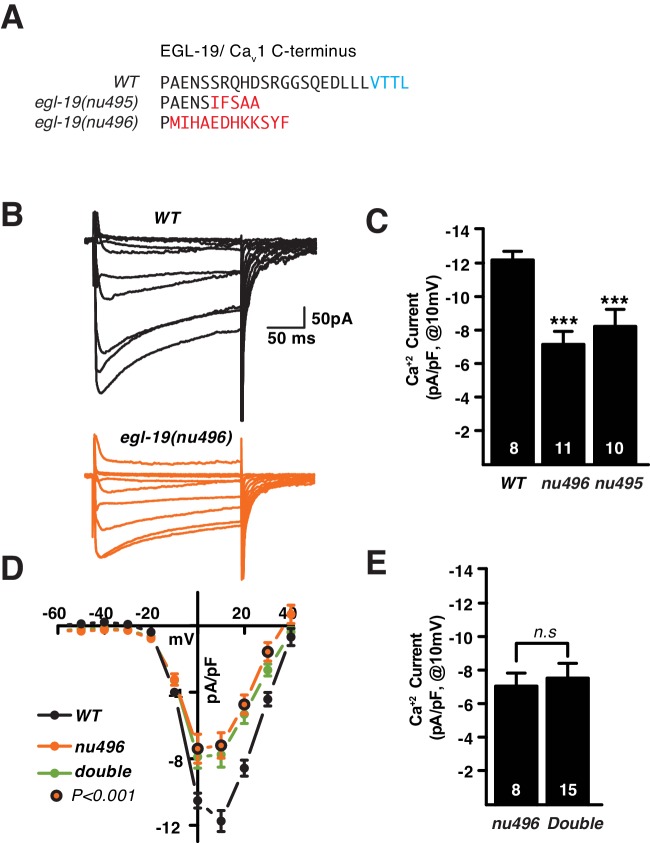
Figure 2. SHN-1 binding to EGL-19’s carboxy-terminus promotes the expression or function of L-type calcium channels.
(A) Predicted c-terminal sequences of mutant EGL-19 proteins are shown. egl-19(nu496) is a 22 bp deletion and egl-19(nu495) is a 5 bp deletion, both resulting in frame shifts that delete the carboxy-terminal PDZ ligand of EGL-19 (-VTTLCOOH). Residues in blue represent the PDZ ligand. Residues in red represent those introduced by the frame shift mutations. (B–E) Voltage-activated Ca+2 currents were recorded from adult body wall muscles of the indicated genotypes at holding potentials of −60 to +40 mV. Representative traces (B), mean current density at 0 mV (C, E), and mean current density as a function of holding potential (D) are shown. The egl-19(nu496) and shn-1(tm488) single mutants had similar decreases in Ca+2 current-density, and additive defects were not observed in the double mutant. The number of animals analyzed is indicated for each genotype. Values that differ significantly from wild type controls are indicated (***p<0.001). Error bars indicate SEM. Mean, standard errors, sample sizes, and p values for this figure are shown in Supplementary file 1.


