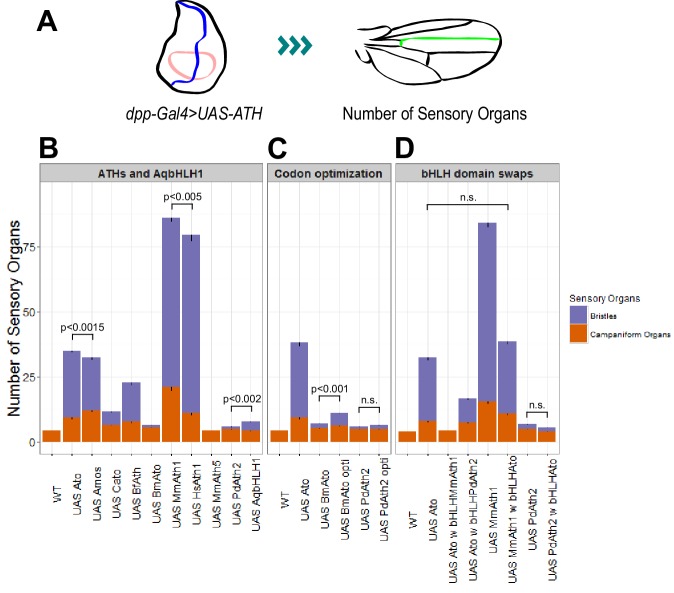
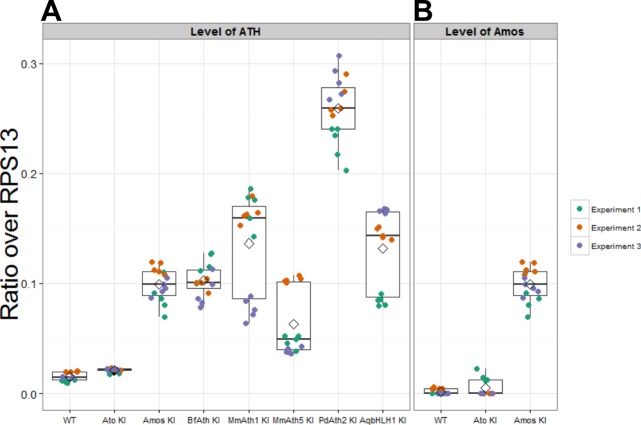
Figure 5. ATHs ectopic expression induces formation of distinct numbers of ectopic sensory organs.
(A) Schematics of the wing disc assay; ectopic sensory organs formed upon ectopic expression of ATHs and AqbHLH1 driven by dpp-Gal4 were counted along the mid-vein until and including the anterior cross-vein. (B–D) Numbers of ectopic sensory organs; data are presented as mean with SEM. Statistics: Wilcoxon rank sum test on the number of bristles except for MmAth1 andHsAth1 on number of campaniform organs. Summary statistics can be found in Supplementary file 6E,F,I,J,M and N and all p-values (Wilcoxon rank sum test) for all pairwise comparisons in Supplementary file 6G,H,K,L,O and P. See also Figure 5—figure supplement 1.


