
Figure 3. Assessment of SUM149-derived tumor spheroid morphology.
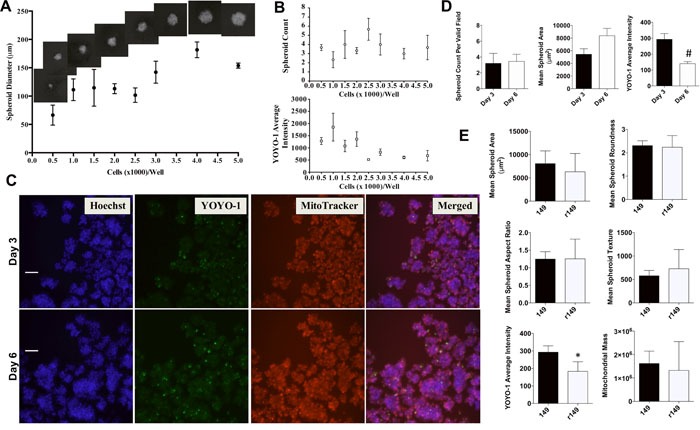
A. SUM149 cells at different seeding densities and visualized on day 3 to assess 3D spheroid size, Representative spheroid images (10x) inset above Figure 3A to show the change in spheroid size for each seeding density. B. Spheroid viability as quantified by average YOYO-1 intensity (top) and count (bottom). Representative data shows mean ± SEM for each parameter [replicates = 3]. C. Representative pictures of individual channel signal and merged overlay showing SUM149 tumor spheroids at days 3 and 6 stained for nuclei (Hoechst), viability (YOYO-1) and mitochondrial membrane potential (MitoTracker Red). Cells fixed before imaging. 150-175 fields of view imaged for each well and 500 fields of view per dye for each well at 10x magnification (Scale bar = 100 microns). D. Quantitative analysis of SUM149 tumor spheroids at day 3 and day 6 for number of spheroids, area (μm2), viability measured by YOYO-1 average intensity. Bars represent mean ± SEM for each parameter [replicate fields/well = 5-18; #P<0.005 comparisons made between days 3 and 6]. E. Quantitative analysis of drug resistant rSUM149 cell line (r149)-derived tumor spheroids compared with SUM149 (149)-derived tumor spheroids at day 3 for indicated parameters on the Y axis in each graph, which includes area (μm2), roundness (shape P2A), aspect ratio (shape LWR), texture (Hoechst variable intensity), YOYO-1 average intensity, mitochondrial mass (total MitoTracker intensity), and mitochondrial brightness (average MitoTracker intensity). Bars represent mean ± SEM for each parameter [replicate fields of viable spheroids/well = 6; *P<0.05 comparisons made between SUM149 and rSUM149].