
Figure 5. Quantitative analysis of XIAP and NFκB inhibitors on IBC tumor spheroid cell morphology, viability and mitochondrial function.
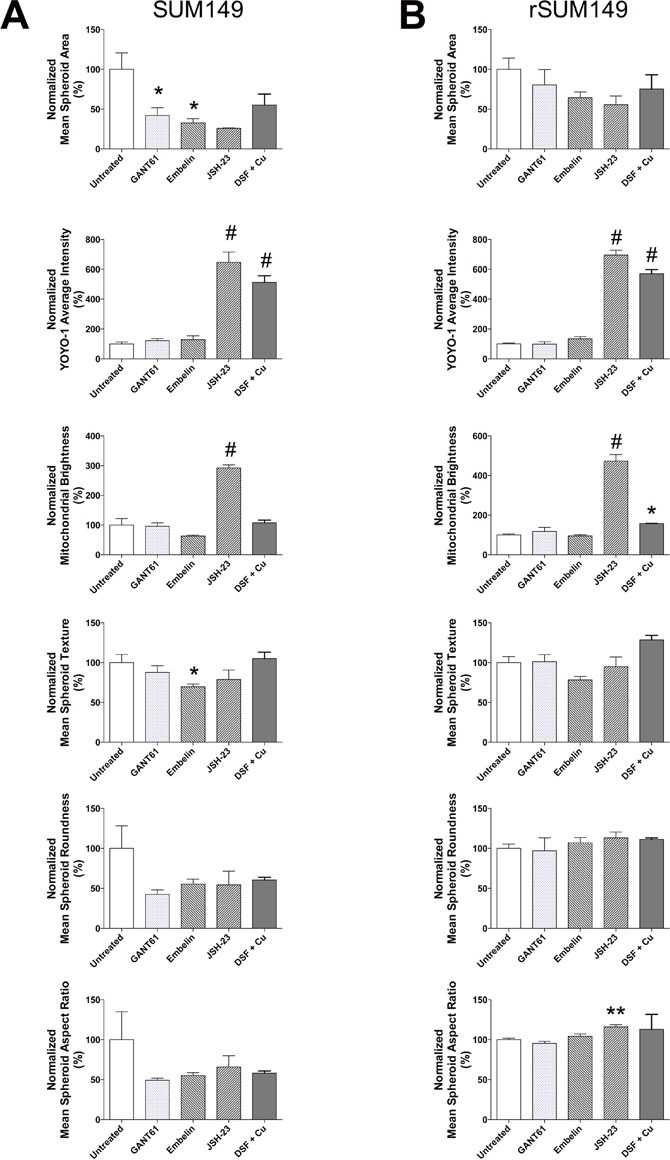
A. SUM149 and B. rSUM149 tumor spheroids at day 3 after indicated treatments. Bars represent mean ± SEM for each parameter [replicate fields of viable spheroids/well = 2-11; *P<0.05, **P<0.01, #P<0.005 comparisons made between each treatment and untreated].