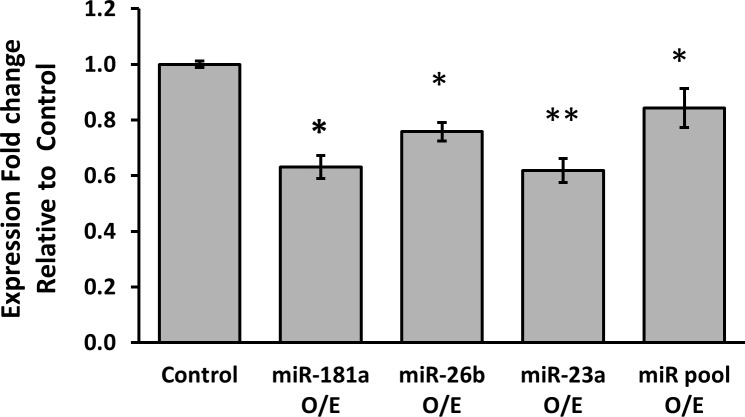
Figure 2. Average expression fold change of PR mRNA, 6 hours following over-expression of each miRNA.
MCF-7 cells were transfected by miR-vec miR-181a, miR-vec miR-26b, miR-23a mimic or miR-vec miR-181a/miR-26b/miR-23a pool, as well as by Empty miR-vec plasmid or Scrambled sequence as control. Levels of PR mRNA were determined by quantitative RT-PCR analysis. The comparative threshold cycle (Ct) method was used for quantification. Values are presented as mean±SEM, n≥5, *p < 0.05, **p < 0.01, two-tailed student's t-test.

