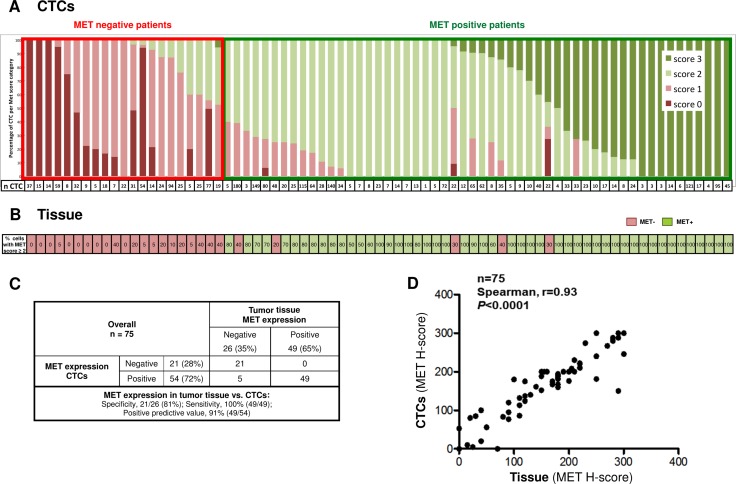
Figure 3.
(A) Distribution of MET scores in CTCs from NSCLC patients analyzed on the ISET system. (B) MET expression in FFPE tissue slides for the same patients. Numbers indicate the percentage of tumor cells with MET protein intensity ≥ 2+ (2+ or 3+). Red, MET negative tumors (≥ 50% tumor with MET intensity 0+ or 1+); Green, MET positive tumors (≥ 50% tumor with MET intensity 2+ or 3+). (C) Concordance of MET expression in tumor tissue and corresponding CTCs from 75 NSCLC patients. (D) Linear concordance between MET H-scores in CTCs vs. tumor tissue.

