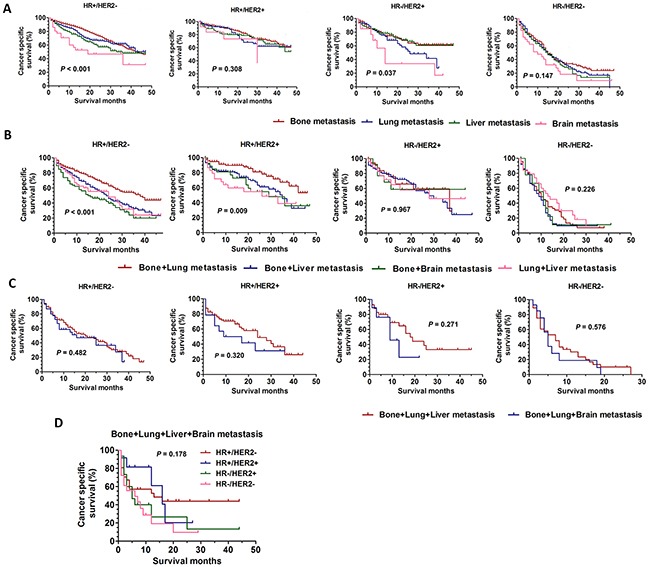
Figure 4. The CSS curves in breast cancer patients with different distant combination metastasis sites.

A. the CSS curves in breast cancer patients with only one distant metastasis site according to different BCS (HR+/HER2-: χ2=29.70, P<0.001; HR+/HER2+:χ2=3.610, P=0.308; HR-/HER2+:χ2=8.461, P=0.037; HR-/HER2-:χ2=5.385, P=0.147). B. the CSS curves in breast cancer patients with two distant metastasis sites according to different BCS (HR+/HER2-:χ2=33.12, P<0.001; HR+/HER2+:χ2=11.49, P=0.009; HR-/HER2+:χ2=0.260, P=0.967; HR-/HER2-:χ2=4.347, P=0.226). C. the CSS curves in breast cancer patients with three distant metastasis sites according to different BCS (HR+/HER2-: χ2=0.494, P=0.482; HR+/HER2+: χ2=0.990, P=0.320; HR-/HER2+: χ2=1.212, P=0.271; HR-/HER2-: χ2=0.313, P=0.576). D. the CSS curves in breast cancer patients with four distant metastasis sites according to different BCS (χ2=4.918, P=0.178).
