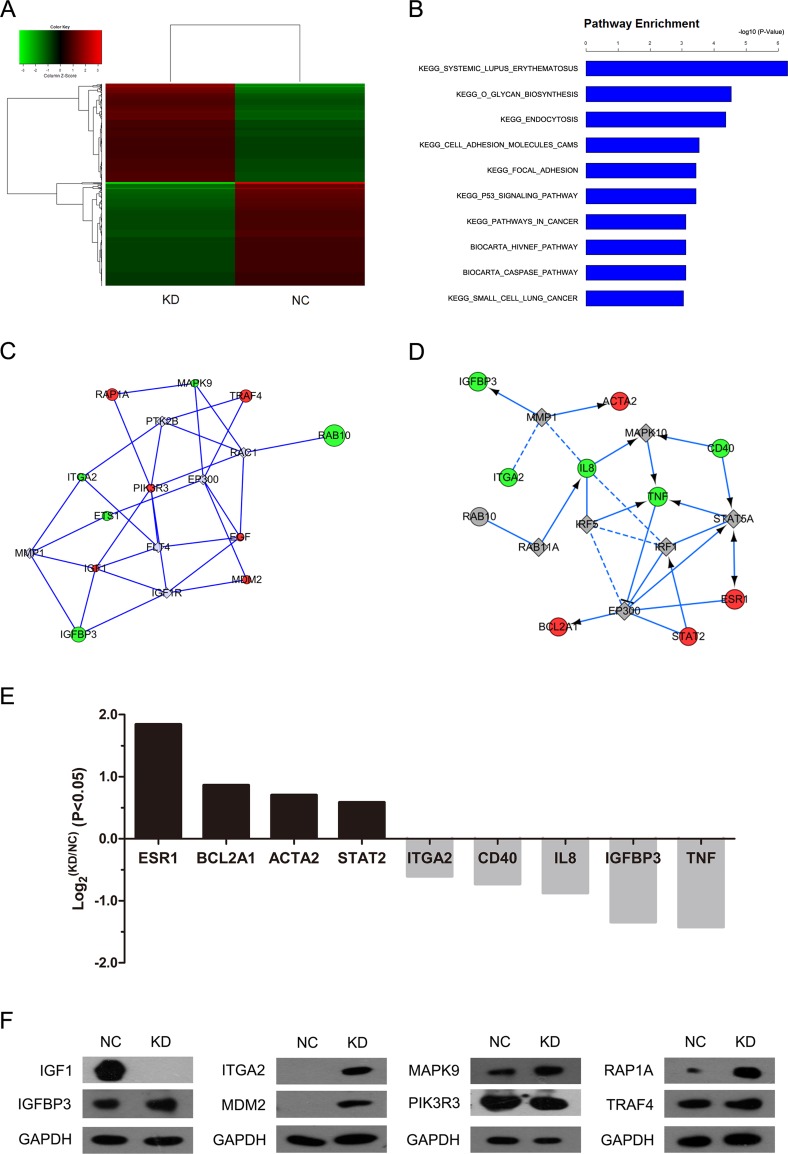
Figure 3. RAB10 knockdown induced global changes in SMMC-7721 gene expression.
NC, cells infected with negative control shRNA lentivirus; KD, cells infected with RAB10 shRNA lentivirus. (A) Heatmap of 695 genes showed significant (P < 0.05) differential expression (fold change > 1) between cells transfected with RAB10 shRNA (green) and with control shRNA (red). Rows and columns represented genes and samples, respectively. A color scale for normalized expression data was shown in the upper left corner of the heatmap (green represented down-regulated genes and red represented up-regulated genes). (B) Functional pathway enrichment of differentially expressed genes was analyzed based on KEGG and BIOCARTA databases. Statistically significant modulations (P < 0.001) of the top 10 pathways were shown. The statistical significance shown on the X axis was represented by the inverse log of the P value. C-D. Networks were constructed between RAB10 and select genes (C) and pathway-related or down-stream genes (D), respectively. Green circles represented down-regulated genes, red circles represented up-regulated genes, and gray rhombuses represented linker genes. Solid arrows indicated confirmed regulatory relationships and dotted lines predicted regulatory relationships. Inhibitory relationships were indicated by “T” bars. (E) Differentially expressed genes (P < 0.05 and fold change > 1) in network (D). (F) Protein levels of select genes in SMMC-7721 cells transfected with negative control shRNA (NC) or RAB10 shRNA (KD) measured by Western blot.

