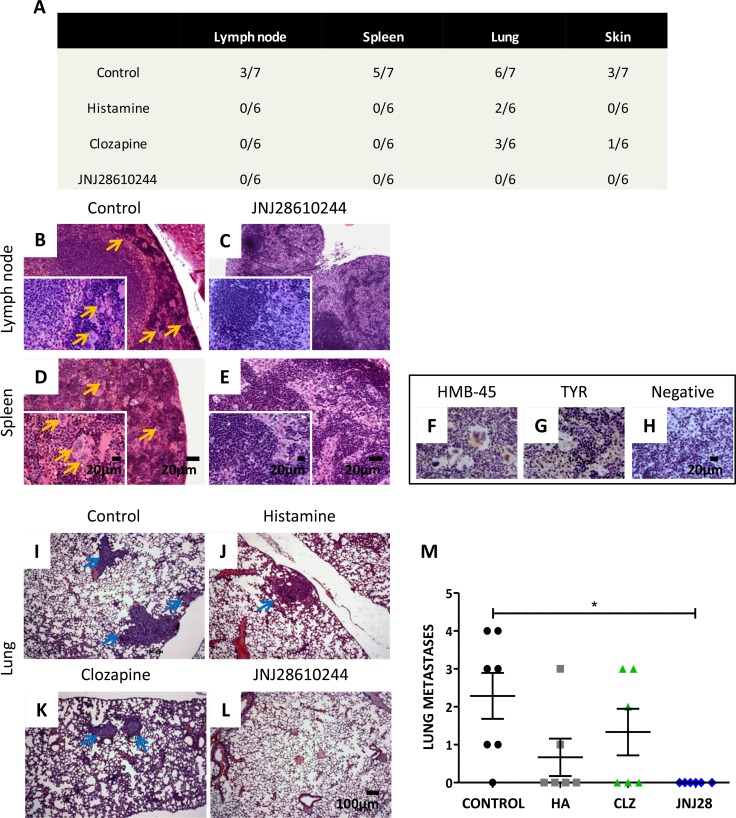
Figure 4. Analysis of the metastatic potential of 1205Lu xenografted tumor in mice.
(A) Number of animals with metastases of the total number of animals in the experimental group. (B) Giant multinucleated cells (yellow arrows) in lymph nodes and (D) in spleen of control mice. (C) Lymph nodes and (E) spleen of 1 mg/kg JNJ28610244 treated mice showing no particularities (H&E staining, 100X-fold magnification, inset: 400X-fold magnification). Scale bar = 20 μm. (F) Representative pictures of HMB-45 and (G) tyrosinase (TYR) positive immunostaining of giant multinucleated cells of spleen, confirming linage specificity. (H) Spleen of treated animals did not give signal for these antigens (negative immunostaining), confirming the absence of metastases. Pictures were taken at 400X-fold magnification. Scale bar = 20 μm. Representative images of lungs from (I) control, (J) histamine, (K) clozapine and (L) JNJ28610244 groups. Blue arrows indicate presence of lung metastases (H&E, 50X-fold magnification, scale bar = 100 μm). (M) The number of lung metastases was evaluated in mice treated with saline solution (control), 1 mg/kg histamine (HA), clozapine (CLZ,) or JNJ28610244 (JNJ28). Each dot represents the number of metastasis per mouse. The middle line represents the average number (Kruskal-Wallis non-parametric Test and Dunn's Multiple Comparison test, *P = 0.0214).

