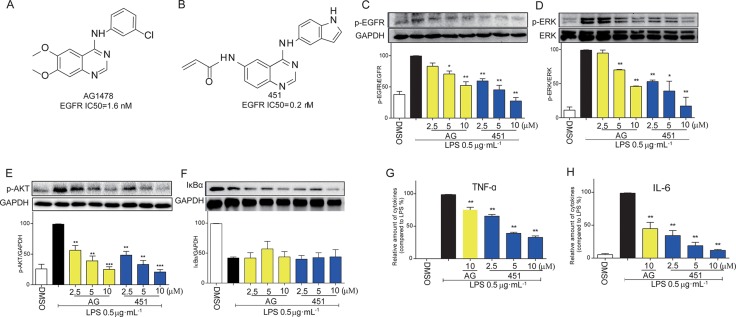
Figure 1. EGFR inhibitors inhibited LPS-induced EGFR signaling pathway and inflammatory production in macrophages.
(A) The chemical structure of EGFR inhibitor AG1478. (B) The chemical structure of EGFR inhibitor 451. (C–F) MPMs were pre-treated with AG1478 or 451 at various doses (2.5, 5, 10 μM) or vehicle (DMSO) for 30 min prior to stimulation with LPS (0.5 μg·mL−1) for 30 min. The total protein was collected and the levels of p-EGFR (C), p-ERK (D), p-AKT (E), and IκBα (F) were detected by Western Blot assay. (G–H) MPMs were pre-treated with AG1478 at 10 μM or 451 at various doses (2.5, 5, 10 μM) or vehicle (DMSO) for 30 min prior to stimulation with LPS (0.5 μg·mL−1) for 24 h. ELISA assay was used to detect the production of inflammatory cytokine TNF-α (G) and IL-6 (H) in medium. Bars represent the mean ± SEM of more than three independent experiments performed in duplicate, and asterisks indicate significant inhibition (*p < 0.05, and **p < 0.01, vs. LPS group).

