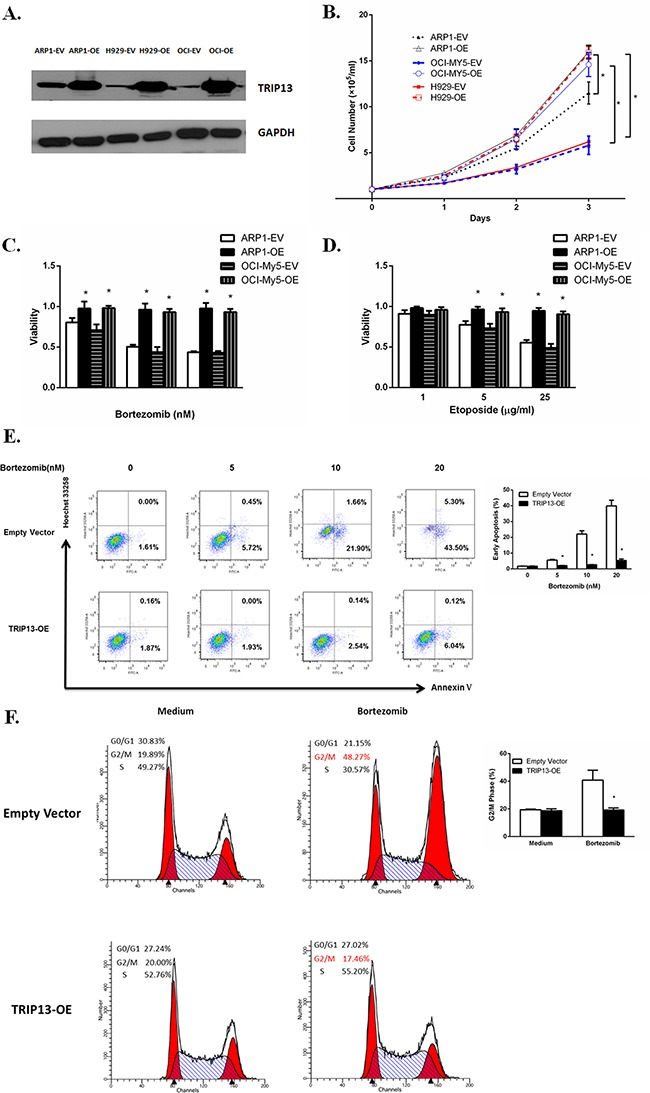
Figure 2. Increased TRIP13 induces cell growth and drug resistance.

A. TRIP13proteins were overexpressed inTRIP13 overexpressing (OE) MM cell lines ARP1, OCI-My5 and H929 compared to their counterparts transfected with empty vectors (EV). B. TRIP13-OE and EV transfected MM cell lines ARP1, OCI-My5 and H929 were counted by trypan blue exclusion for consecutive 3 days. High levels of TRIP13 significantly promoted myeloma cell growth. Results from 3 independent experiments are shown (EV vs. OE, *p < 0.05). C. and D. TRIP13-OE MM cell line ARP1 or OCI-My5 and their EV-transfected control cells were treated with indicated concentrations of proteasome inhibitor Bortezomib (C) or topoisomerase inhibitor Etoposide (D). Cell viability assay was performed 24 h later using PrestoBlue Cell Viability reagent. Results from 3 independent experiments are shown (*p<0.05). E. FITC-conjugated Annexin V/Hoechst 33258 staining was performed on TRIP13-OE MM cell line ARP1 or empty vector-transfected cells 18 h post different doses of Bortezomib treatment by flow cytometry (FCM). Cells that are in early apoptosis are Annexin V positive and Hoechst 33258 negative. Representative pictures of FCM were shown (left panel) with quantification of percentage of cells with early apoptosis (right panel). Results from 3 independent experiments are shown (*p < 0.05). F. TRIP13-OE MM cell line ARP1 or empty vector-transfected cells were treated with 20nMBortezomib for 24 h. Then cells were stained with propidium iodide (PI) and assayed for DNA content by FCM. TRIP13 overexpression lessened the Bortezomib-induced G2/M cell cycle arrest in myeloma cells compared to control cells. Representative pictures of FCM were shown (left panel) with quantification of percentage of cells at G2/M phase (right panel). Results from 3 independent experiments are shown (OE vs. EV, *p < 0.05).
