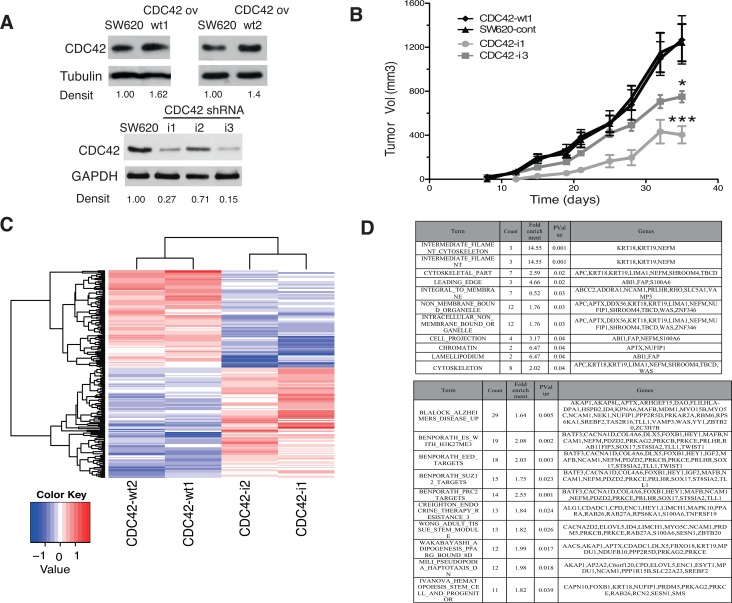
Figure 1. In vivo and transcriptional features of SW620 cell clones with altered CDC42 expression.
(A) Protein levels of CDC42 determined by Western blot analysis in the selected SW620 cell clones to perform microarray studies. Tubulin or GAPDH were used as loading controls. Densitometrical analysis (Densit) of relative amount of CDC42 in each cell line compared to expression in parental cell line that was set to 1.0 is shown. Please note that the Western blot for CDC42 ov was cropped from a Western blot containing other clones to show the selected clones. The original image of this Western blot is shown in Supplementary Figure 1A. (B) Tumor growth of SW620 xenografts in athymic nude mice. A total of 106 cells of each cell line (CDC42-wt1, parental SW620 cell line, CDC42-i1 and CDC42-i3) were injected subcutaneously in each flank of nude mice. Tumor volumes were determined twice a week for 35 days (*significantly different from control on day 35, p-value = 0.010, and ***significantly different from control on day 35, p-value = 0.004). (C) Heatmap showing the 190 differentially expressed genes using a fold-change cut-off of 1.5 in both groups of cells overexpressing CDC42 (CDC42-wt1 and CDC42-wt2) or with silenced CDC42 expression (CDC42-i1 and CDC42-i2) when compared to the parental SW620 cell line and then opposite differential expression between CDC42ov and CDC42i. (D) Gene Set Enrichment Analysis (GSEA) of the 190 differentially expressed genes. The upper panel shows GSEA analysis against the Molecular Signatures Database v4.0 (MSigDB) GO gene sets (C5)/GO cellular component collection (p-value < 0.05) and the bottom panel shows the top ten gene sets against the curated gene sets (C2)/canonical pathways collection ordered by count (number of genes from the 190 list included in each data set). See Supplementary Table 3 for the full list.

