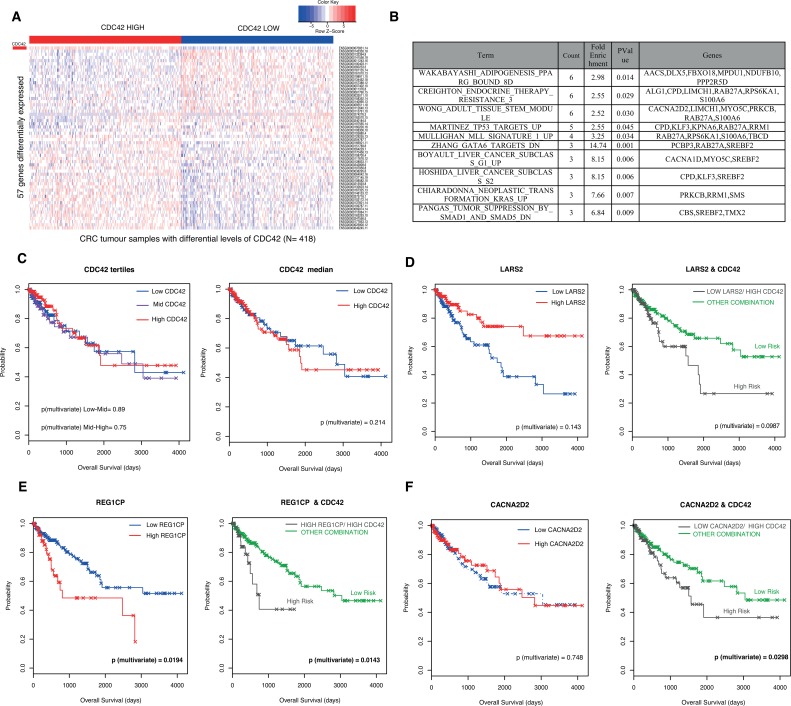
Figure 2. Validation of CDC42-transcriptional signature in CRC patients from The Cancer Genome Atlas (TCGA) Rectum Adenocarcinoma (READ) and Colon Adenocarcinoma datasets (COAD).
(A) Heatmap of expression represented as Z-score of the 57 genes found to be correlated with CDC42 in the patient samples. Patients (N = 628) were stratified according to CDC42 expression levels and the top and bottom tertiles are shown in this heatmap. CDC42 expression levels are indicated in the first row (marked as a red rectangle). The top tertile is called “CDC42 HIGH” (red bar) and the bottom tertile is represented as “CDC42 LOW” (blue bar), this accounts for a total number of 418 patients. (B) Top ten gene sets from GSEA of the 57 differentially expressed genes analysis against the Molecular Signatures Database v4.0 GO gene sets against the curated gene sets (C2) /canonical pathways collection (p-value < 0.05) ordered by count. See Supplementary Table 5 for the full list. (C) Kaplan Meier (KM) plots for the overall survival analysis of 453 patients according to CDC42 levels. Left hand side (LHS) graph shows the survival curve stratifying the patients according to CDC42 tertiles (low, blue; mid, purple and high, red) and the right-hand side (RHS) plot according to CDC42 median (low, blue and red, high). Univariate and multivariate analysis were performed to evaluate the prognostic significance, and p-values from the multivariate analysis are shown in the graphs. A prognostic risk identifier was found in LARS2 (D), REG1CP (E) and CACNA2D2 (F) when combined with CDC42 levels. The LHS KM plots show the survival analyses for these genes alone where high levels are represented in red and low levels are blue. The high-risk groups (gray) were then identified by taking the intersect of the CDC42 high expression and LARS2 low expression (D) REG1CP high expression (E) and CACNA2D2 low expression (F) groups and compared to any other combination (green). p-values for multivariate analysis for each case are shown.

