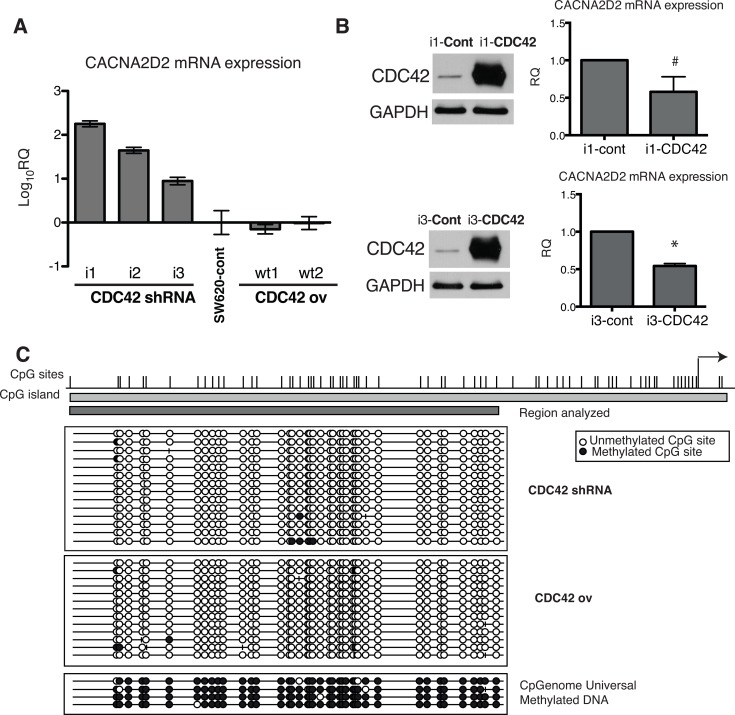
Figure 4. Transcriptional regulation of CACNA2D2 by CDC42 in SW620 cells.
(A) CACNA2D2 gene expression in our cellular model was determined by qPCR in the different stable cell lines and compared to the levels in the parental SW620 cell line by the 2−ΔΔCT method. The results are shown as Log10 of relative quantity (RQ) of CACNA2D2 in each cell line using control SW620 cells as reference. (B) LHS: CDC42 protein expression was determined by Western blot after transient overexpression of CDC42 (the original image of this Western blot is shown in Supplementary Figure 4A). Stable CDC42 interfering cell lines, i1 and i3, were transiently transfected with empty plasmid (Cont) or wild type form of CDC42 (CDC42) and CDC42 expression was determined at 48 h post-transfection. RHS: CACNA2D2 gene expression determined by qPCR after transient overexpression of CDC42 in i1 and i3 cell lines. Expression was normalized using 18S as reference. Data are presented as the quantity of CACNA2D2 expression in the CDC42-i1 and CDC42-i3 cell lines transiently overexpressing CDC42 (i1-CDC42 and i3-CDC42, respectively) relative to the expression in the lines transfected with the empty plasmid as controls (i1-cont and i3-cont, respectively). #p-value = 0.1, *p-value = 0.0001, N = 3. (C) Bisulfite sequencing analysis of CACNA2D2 promoter region. Bisulfite maps determined by direct sequencing of individual clones show the density of methylated CpG sites (black circles) and unmethylated CpG sites (white circles) at individual CpG residues. Virtually all sites were fully methylated when sequencing. CpGenome Universal Methylated DNA was used as positive control. Representative results of SW620 cells with silenced CDC42 expression (CDC42 shRNA) and cells overexpressing CDC42 (CDC42 ov) are shown.

