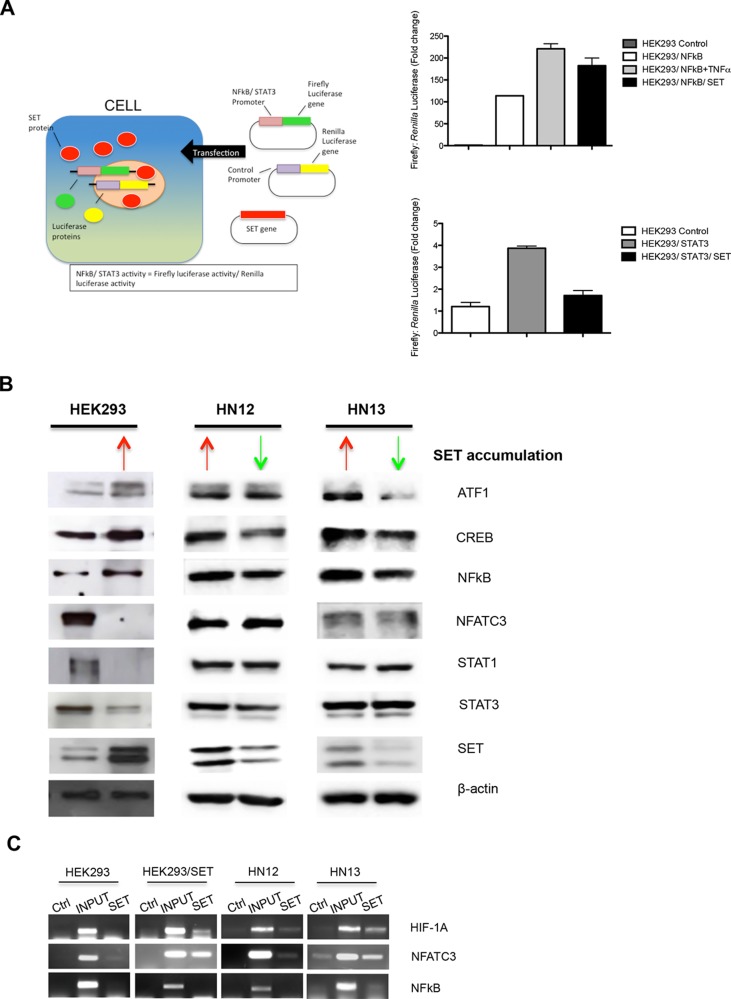
Figure 6. SET contributes to low gene expression levels through chromatin association.
(A) Luciferase reporter assay was performed to quantify NFkB and STAT3 expression induced by SET accumulation. HEK293 cells were transfected with plasmids containing cDNA to overexpress SET, and plasmids with gene promoter region for NFkB (PGL3-NFkB-Luc) and STAT3 (PGL3-STAT3-Luc). (B) Western blot assay was used to assess whether downregulation of gene expression could be controlling protein levels. Total proteins were obtained from HEK293, HEK293/SET, HN12, HN12siSET, HN13, and HN13siSET cells. ATF1, CREB, NFkB, NFATC3, STAT1, STAT3, SET, and β-actin proteins were analyzed. Red arrows indicate SET accumulation; green arrows indicate SET downregulation. (C) Chromatin immunoprecipitation assay was performed to assess whether SET is able to downregulate the expression of transcription factor genes through binding to the promoter. DNA of the respective cells was immunoprecipitated with anti-SET antibody, and PCR was performed using primers for HIF-1A, NFATC3, and NFkB promoters. Ctrl lanes represent samples immunoprecipitated using anti-IgG antibody; INPUT samples consist of total DNA; SET lanes refer to DNA immunoprecipitated with anti-SET antibody.

