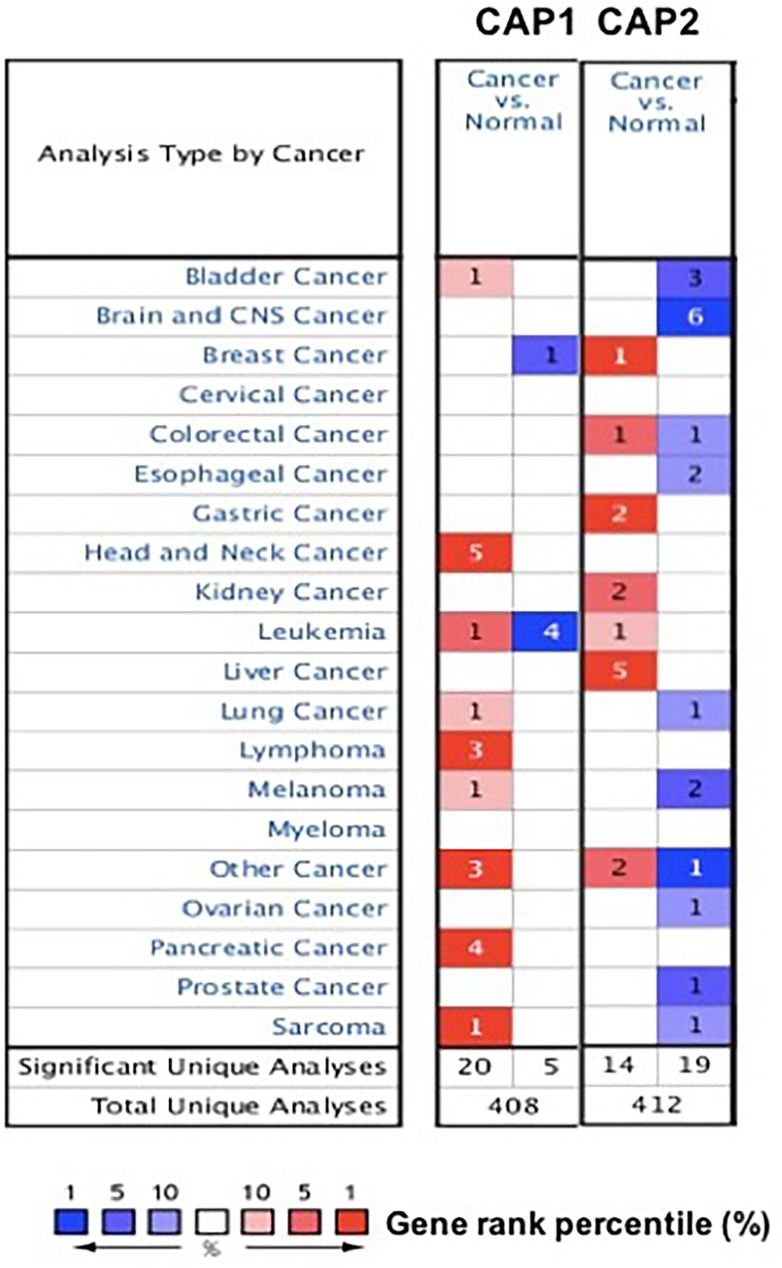
Figure 1. CAP mRNA expression in various cancer types.
The comparison indicated the number of datasets with CAP mRNA overexpression (right column, red) and under expression (left column, blue) in cancer versus normal tissue. The threshold was designed with following parameters: p-value of 1E-4, fold change of 2, and gene ranking of 10%.

