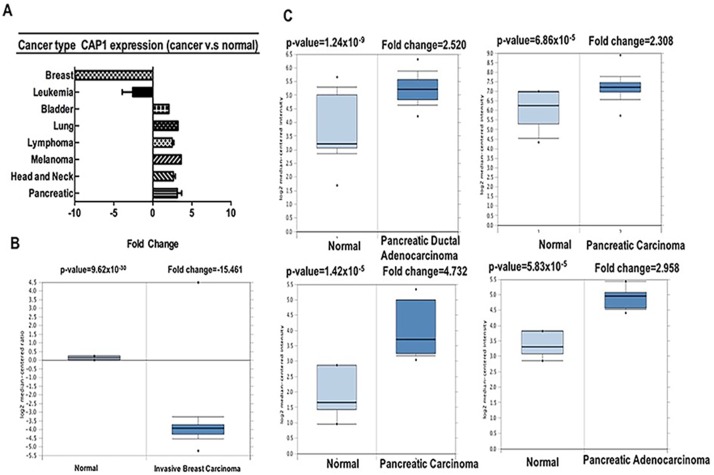
Figure 2. CAP1 analysis in different cancer types (Oncomine database).
The box plot comparing specific CAP1 expression in normal (left plot) and cancer tissue (right plot) was derived from Oncomine database. The fold change of CAP1 in various types of cancers was identified from our analyses in Table 1 and expressed as the forest plot (A). The analysis was shown in breast carcinoma relative to normal breast (B), in pancreatic carcinoma relative to normal pancreatic (C).

