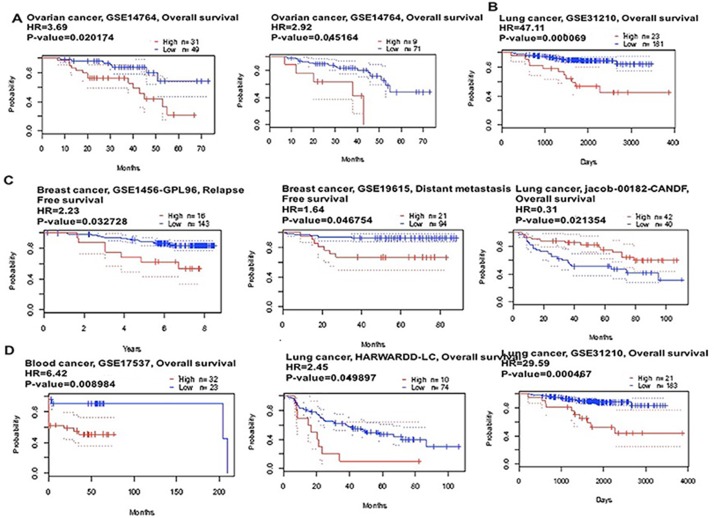
Figure 4. CAP1 genes in Ovarian, Lung, Breast and Blood cancer types (PrognoScan database).
The survival curve comparing the patient with high (red) and low (black) expression was plotted from PrognoScan database. The survival curve comparing the patient with high (red) and low (black) expression in ovarian cancer (A), lung cancer (B), breast cancer (C) and blood cancer (D) was plotted from PrognoScan database as the threshold of cox p-value < 0.05.

