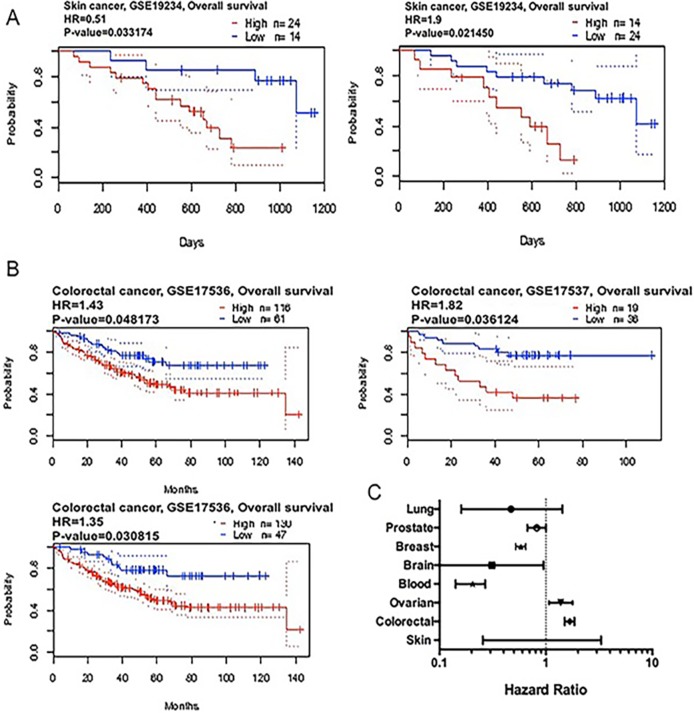
Figure 8. CAP2 genes in Skin and Colon cancer (PrognoScan database).
The survival curve comparing the patient with high (red) and low (black) expression in skin (A) and colon cancer (B) were plotted from PrognoScan database as the threshold of cox p-value < 0.05. The statistically significant hazard ratio in various types of cancers was identified from our analyses in Table 4 and expressed as the forest plot (C).

