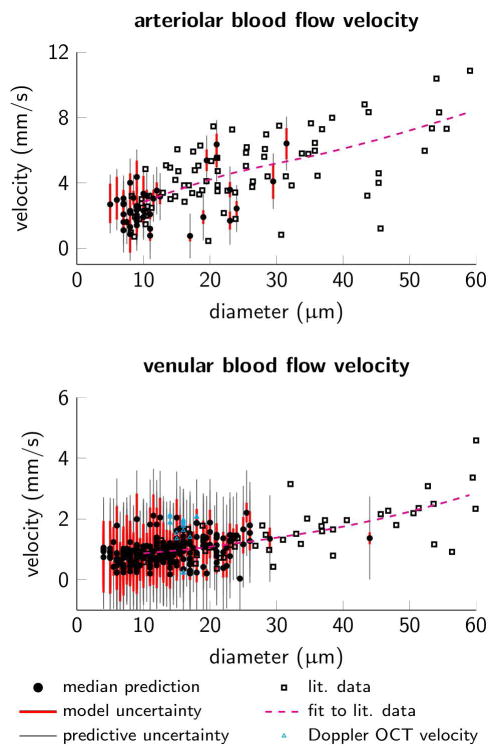
Figure 10.
Blood flow velocity versus diameter. (A) Arteriolar segments and (B) venular segments, note different scales on the velocity axes. Black squares mark empirical measurements of blood flow velocities (literature data from another experiment but same mouse strain and anesthetic regime) [31] and the dashed magenta lines are local polynomial regression fits of the literature data [3]. Cyan triangles mark 17 Doppler OCT velocity measurements available in ascending venules. Black dots mark median model predictions, red and gray bars mark prediction uncertainty due to model parameter uncertainty and total predictive uncertainty respectively (95% credible intervals).

