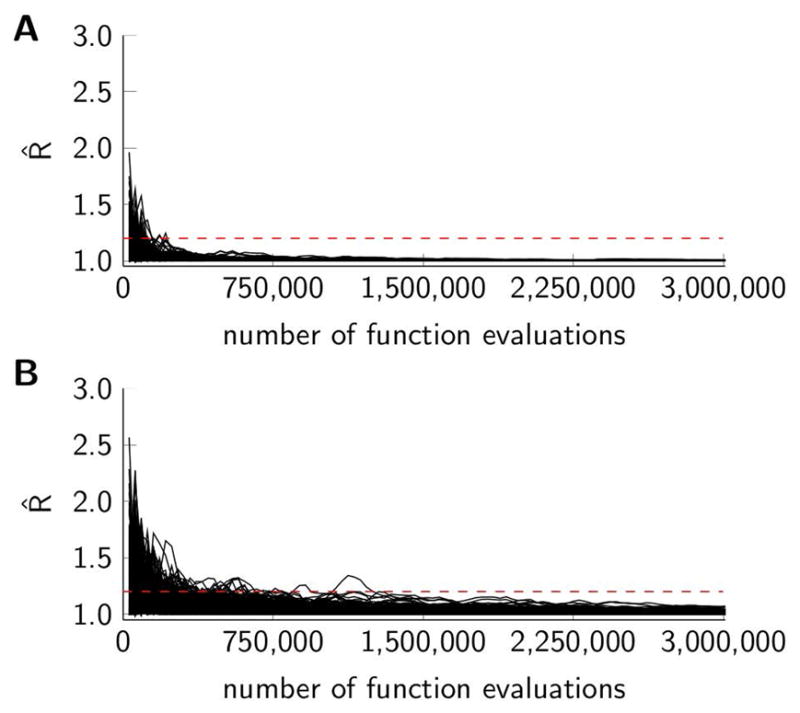
Figure 2.

Evolution of the Gelman-Rubin R̂ convergence statistics versus the number of function evaluations (three chains iterated in parallel each with 1,000,000 MCMC iterations leading to a total of 3,000,000 function evaluations). Black curves represent individual parameters, and the dashed horizontal line indicates a convergence threshold of 1.2. (A) Three mesentery networks, 196 parameters. (B) Brain cortex network, 590 parameters.
