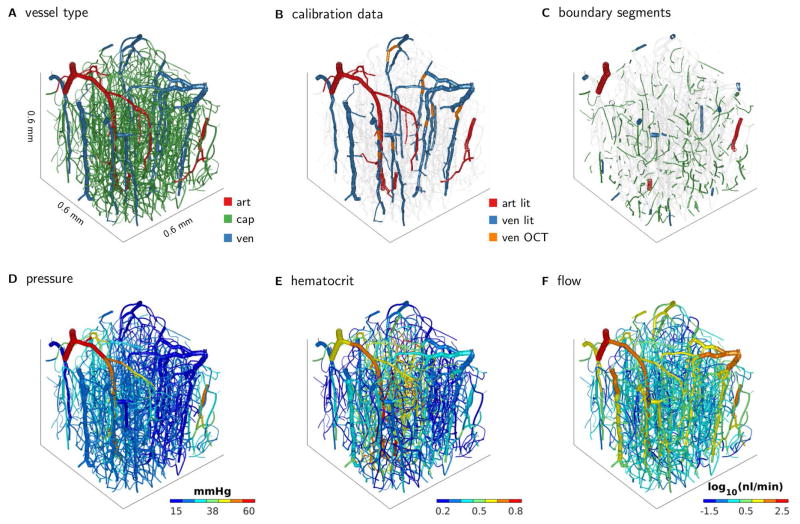
Figure 9.
Brain network from mouse cortex. (A) Segments colored according to vessel classification. (B) Colored segments indicate segments for which velocity data was available for model calibration. Velocity data origins partially from literature data and partially from Doppler OCT measurements. (C) Colored segments indicate boundary segments for which unknown boundary pressures and hematocrit were inferred. Markov chain Monte Carlo simulation was used to infer distributions of the unknown boundary conditions, and model predictions are obtained by propagating the individual samples through the flow simulation model. Plots in the bottom row summarize model predictions by showing mean model predictions of (D) flow, (E) hematocrit, and (F) flow.

