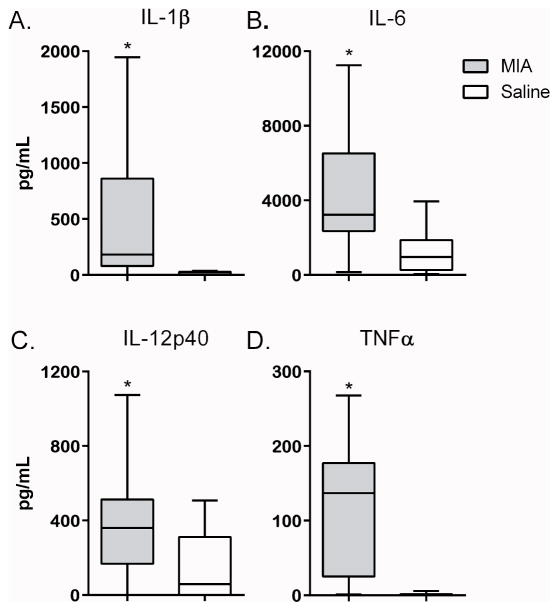
Figure 1. Year 1 Induced cytokine production.
Induced cytokine production from year 1 offspring after stimulation with TLR-3 agonist poly IC. Graphs depict innate cytokine levels of IL-1α (a), IL-6 (b), IL-12p40 (c) and TNFα (d) between MIA offspring (grey bars) and control offspring (white bars). Concentrations shown in pg/mL. Data depicted as box showing 25–75 percentiles and whisker percentiles and 5–95percentiles. *denotes p-value < 0.05.

