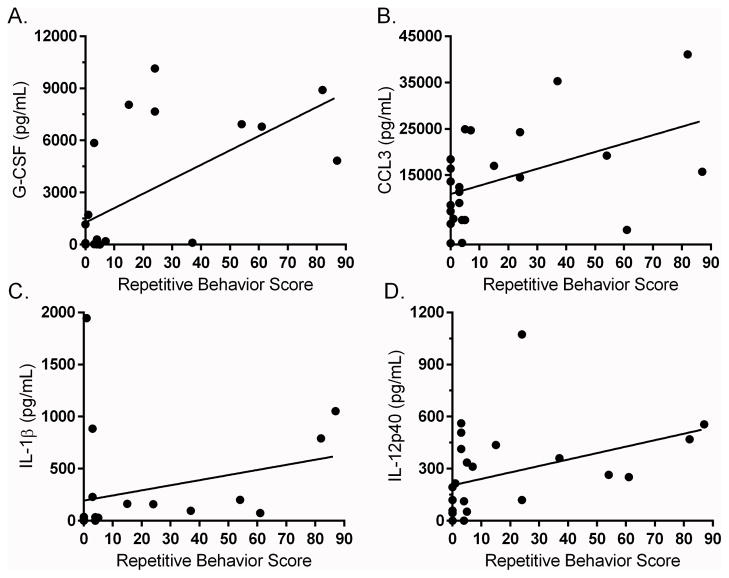
Figure 3. Year 1 cytokine and behavior associations.
Year 1 cytokine correlations to repetitive behaviors. Top row (a–c) illustrate relationship between TLR-4 induced chemokine production and post-weaned repetitive behavior scores. Bottom row illustrates relationship between TLR-3 induced innate cytokines and post-weaned repetitive behavior score (d–f). Cytokines concentration is shown as pg/mL.

