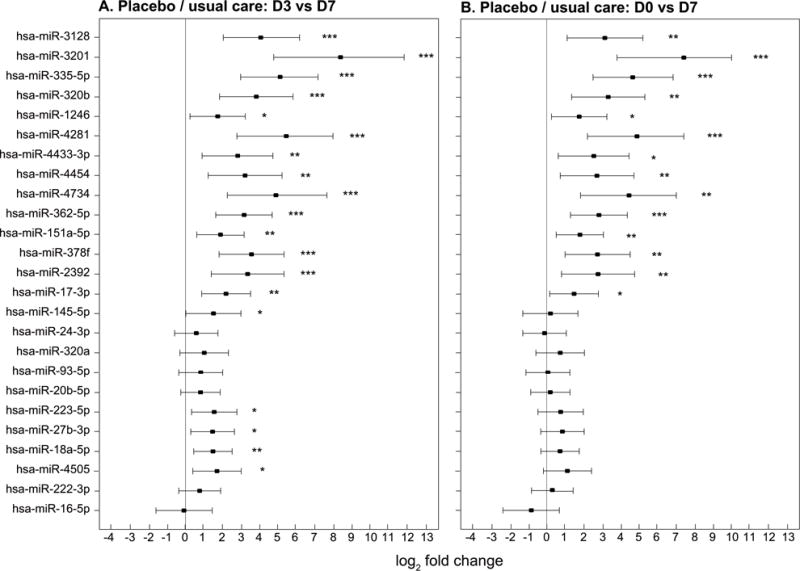
Figure 4. Changes in miRNA in patients who received placebo/usual care.

The x-axis shows miRNA fold change in RT-PCR values represented by log2 fold change and the y-axis shows each of the 25 individual miRNA. The point estimates of fold change with 95% confidence intervals are shown. Significant temporal changes in miRNA expressions are represented graphically as: * p<0.05, ** p<0.01 and *** p<0.001. a: Changes in miRNA expression from ARDS day 3 to day 7 for 14 patients who received placebo/usual care. There was significant increase in miRNA expression (p<0.05) between day 3 and day 7 for 19 of the 25 miRNA evaluated. b: Changes in miRNA expression from ARDS day 0 to day 7 for 14 patients who received placebo/usual care. There was significant increase in miRNA expression between day 0 and day 7 for 14 of the 25 miRNA evaluated.
