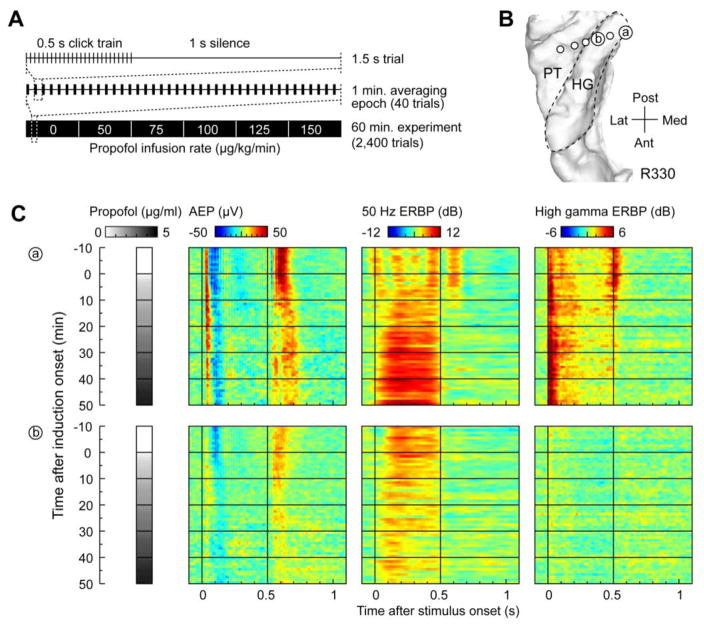
Figure 3.
Auditory cortical responses recorded from posteromedial HG during induction of propofol anesthesia. Exemplary data from subject R330. A: Experiment time course schematic. Single trial (1.5 s), 40-trial averaging epoch (1 min.) and the entire experiment (60 min.) are depicted on top, middle and bottom, respectively. B: MRI top-down view of superior temporal plane showing the location of chronically implanted depth electrode and two representative sites in posteromedial HG (‘a’ and ‘b’). HG is denoted by a dashed line. C: Time course of changes in AEP voltage, FFR (measured as ERBP at 50 Hz) and high gamma ERBP (left, middle and right color plots, respectively) recorded from sites ‘a’ and ‘b’ (top and bottom row, respectively). Each color plot represents a series of one-minute (40-trial) peristimulus averages, arranged according to time after induction onset (top to bottom). Grayscale bars represent propofol brain concentrations, estimated using pharmacokinetic and pharmacodynamic data (see Methods).

