Figure 1.

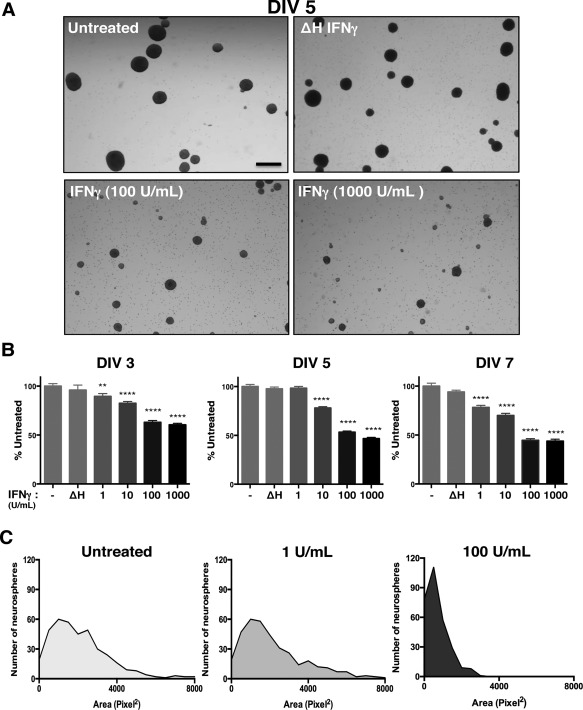
IFNγ inhibits neurosphere growth in a concentration‐dependent manner. Wild‐type NSPCs (WT/NSPCs) were treated with IFNγ (1‐1000 U/ml) or with heat‐inactivated IFNγ (ΔH IFNγ; 1000 U/ml) as a negative control for 3, 5, or 7 days in vitro (DIV). A: Representative images of neurospheres imaged 5 days post‐IFNγ treatment at 2x magnification for different concentrations of IFNγ (Scale bar = 250 μm). B: Quantitation of neurosphere diameter at 3, 5, and 7 days post‐IFNγ treatment. The longest diameter of each neurosphere was measured using Image J software. Data was collected from neurospheres in five fields/condition from three biological replicates and graphed as a percentage of untreated controls. Statistical analysis was applied by one‐way ANOVA (** p < 0.01, **** p < 0.0001). C: Histogram plots of neurosphere area for different concentrations of IFNγ on DIV 5 as measured by pixel2 for each neurosphere. For each condition, five fields/condition were measured using cells from three biological replicates. Frequency distribution of the number of neurospheres corresponding to the indicated neurosphere area in pixel2 was plotted for each condition.
